Copyright
©The Author(s) 2016.
World J Gastroenterol. Jun 14, 2016; 22(22): 5211-5227
Published online Jun 14, 2016. doi: 10.3748/wjg.v22.i22.5211
Published online Jun 14, 2016. doi: 10.3748/wjg.v22.i22.5211
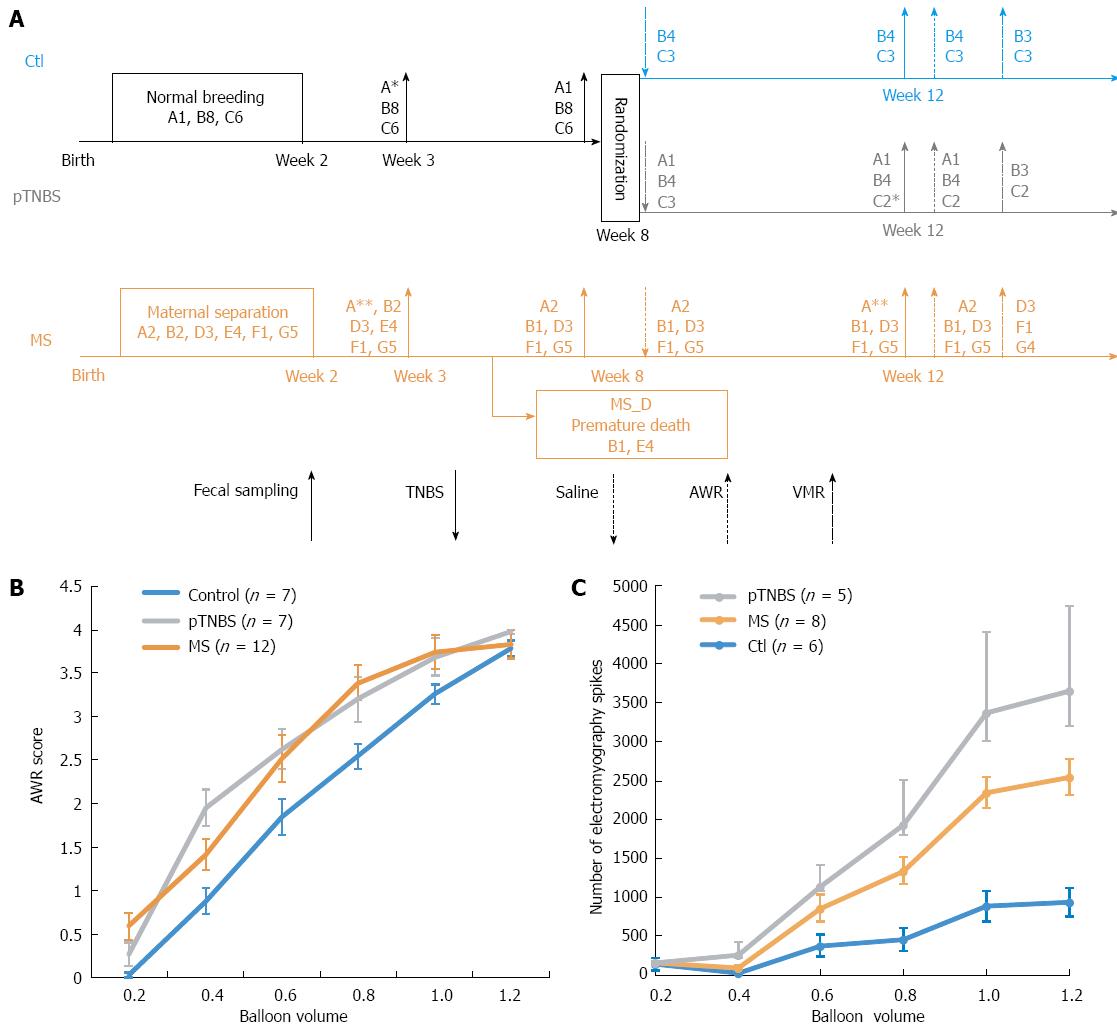
Figure 1 Study design and visceral sensitivity evaluation.
A: Schematic flow chart showing the treatment and co-housing relationship of involved rats. For each code, such as “B8”, the character “B” indicates the nest and number 8 indicates the number of rats. They were cohoused until “B4”, which indicates that four of them were randomly chosen and cohoused together. The asterisk indicates fecal samples that failed to return the sequencing data; B: Abdominal withdrawal reaction (AWR) score in response to the graded colorectal distention (CRD); C: Visceromotor response (VMR) score in response to graded CRD. MS: Maternal separation; MS_D: MS early death; pTNBS: TNBS post-inflammatory.
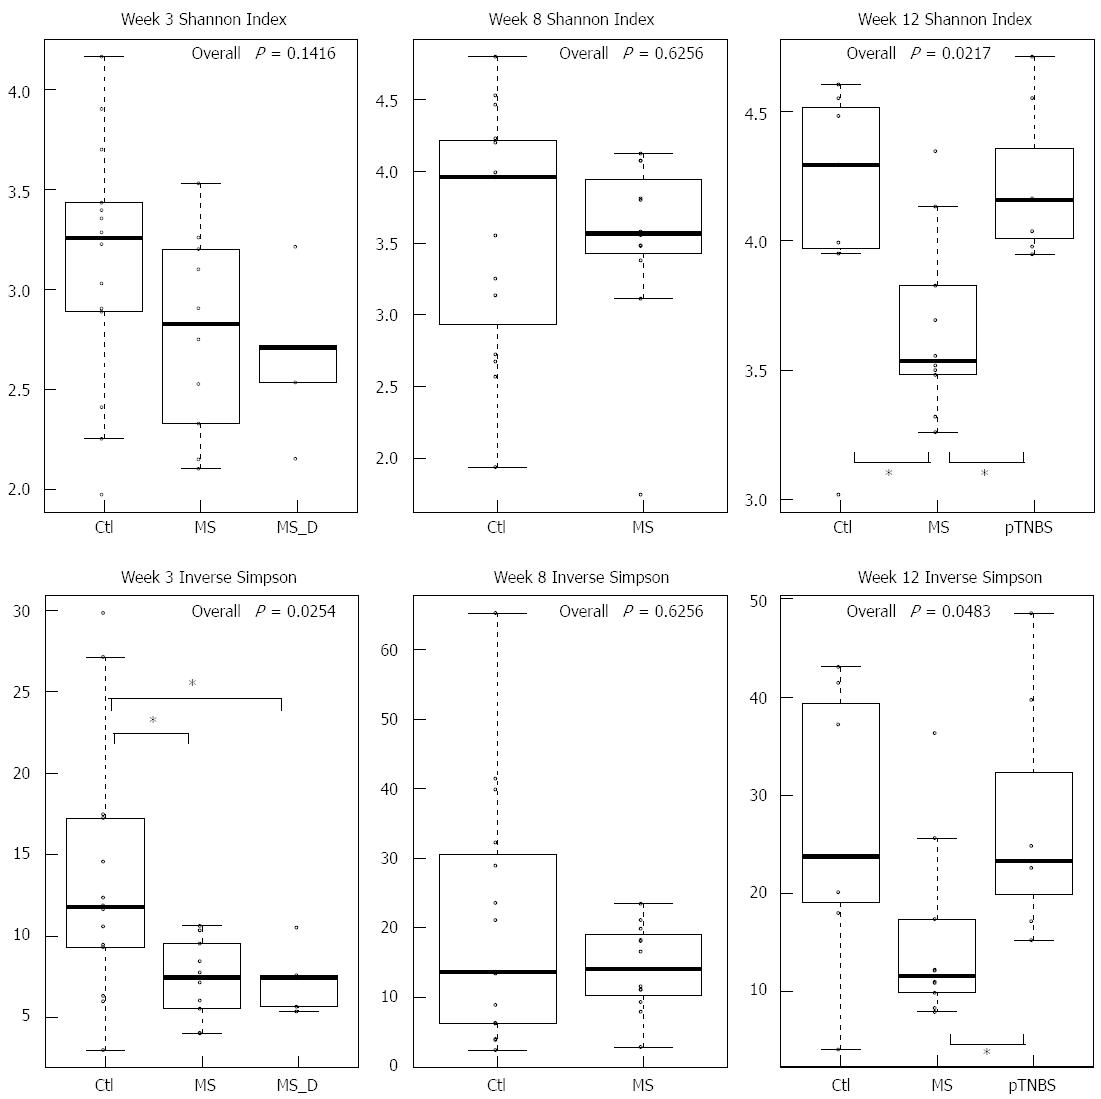
Figure 2 Microbial diversity.
Shannon index (upper panel) and inverse Simpson (lower panel) of fecal microbiota at weeks 3, 8 and 12. Asterisk indicates P < 0.05 in pairwise comparison. MS: Maternal separation; MS_D: MS early death; pTNBS: TNBS post-inflammatory.
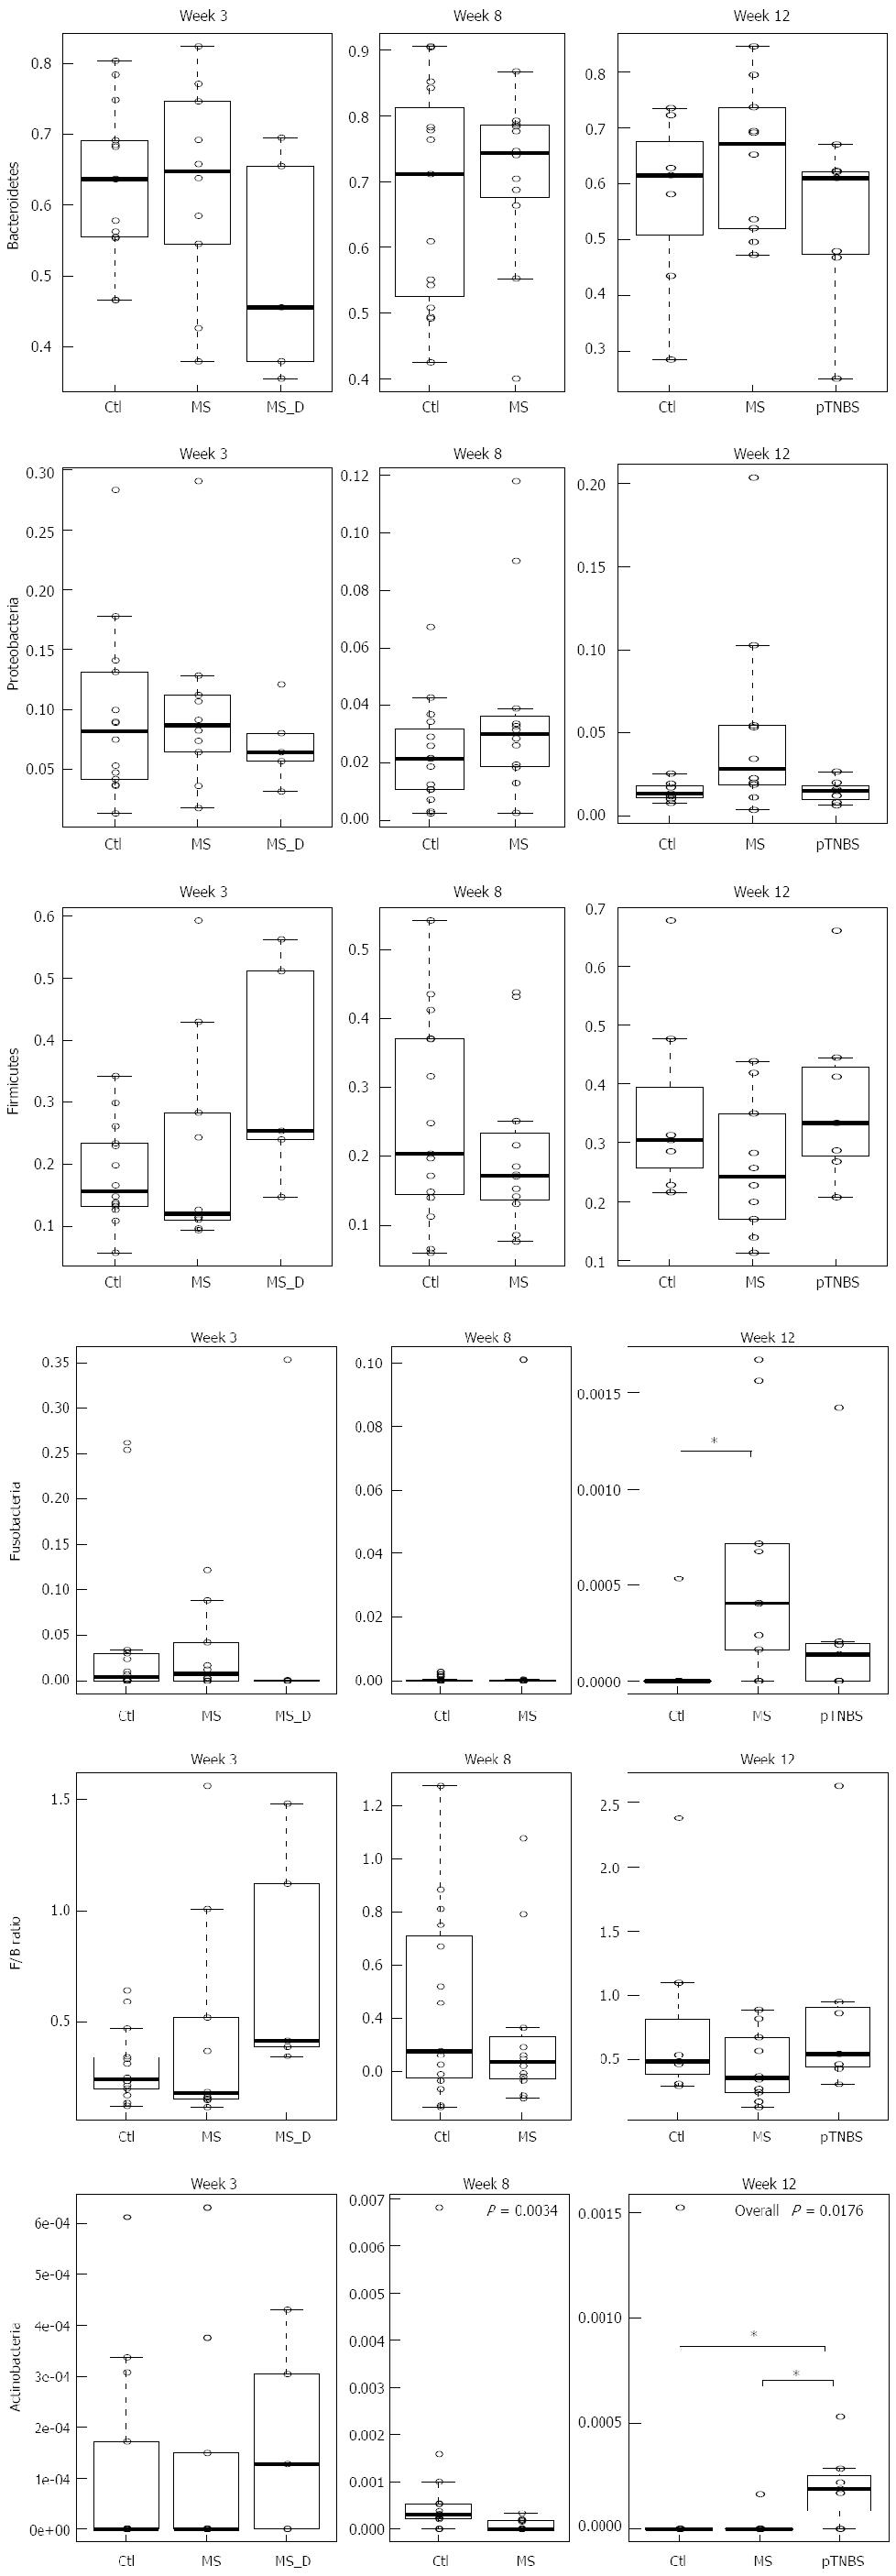
Figure 3 Phyla abundance by weeks 3, 8 and 12.
Asterisk indicates P < 0.05 in pairwise comparison. P > 0.05 (no significant), unless the P-value is drawn in the plot box. MS: Maternal separation; MS_D: MS early death; pTNBS: TNBS post-inflammatory.
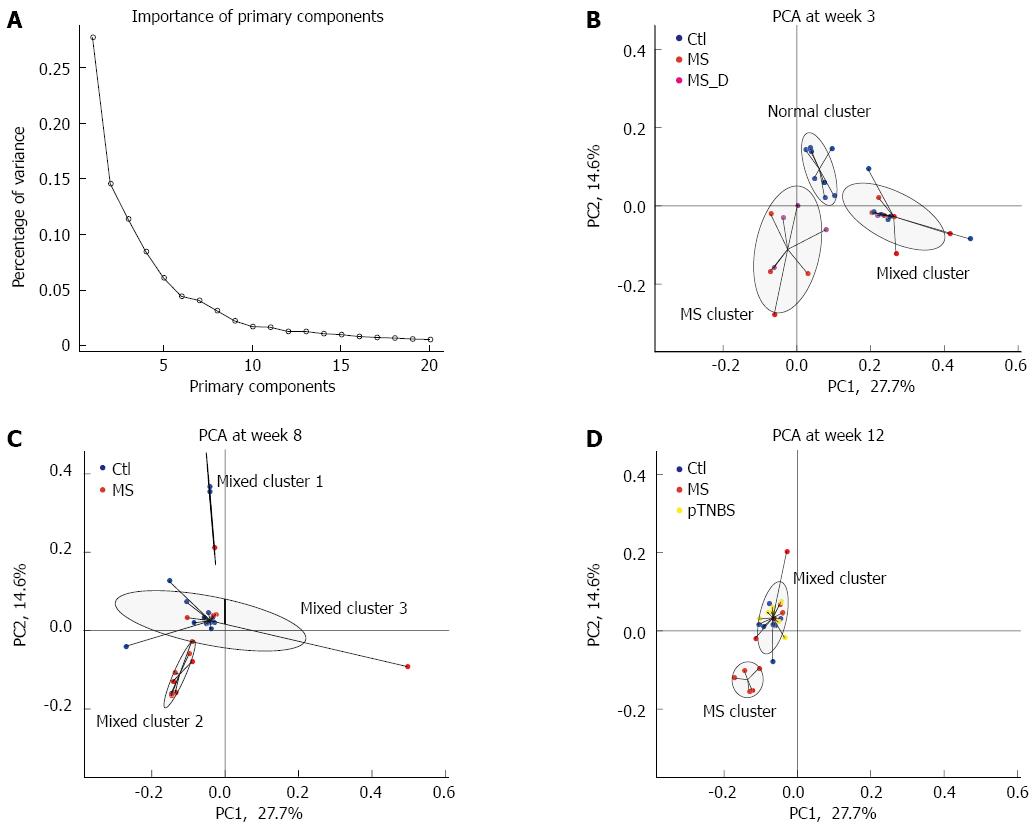
Figure 4 Primary component analysis and cluster analysis by time points.
Primary components were calculated from the relative abundance of all 2413 OTUs. A: The percentage of variances explained by the first 20 primary components. The primary component was separately plotted at week 3 (B), week 8 (C), and week 12 (D). The cluster analysis divided the samples into three clusters, and the samples in the same cluster were connected together. The ellipse was estimated to cover 75% of dots in this cluster. Each cluster was named according to the samples involved in this cluster. The MS group formed isolated clusters, indicated as “MS cluster”, at week 3 and week 12. MS: Maternal separation; PCA: Primary component analysis.
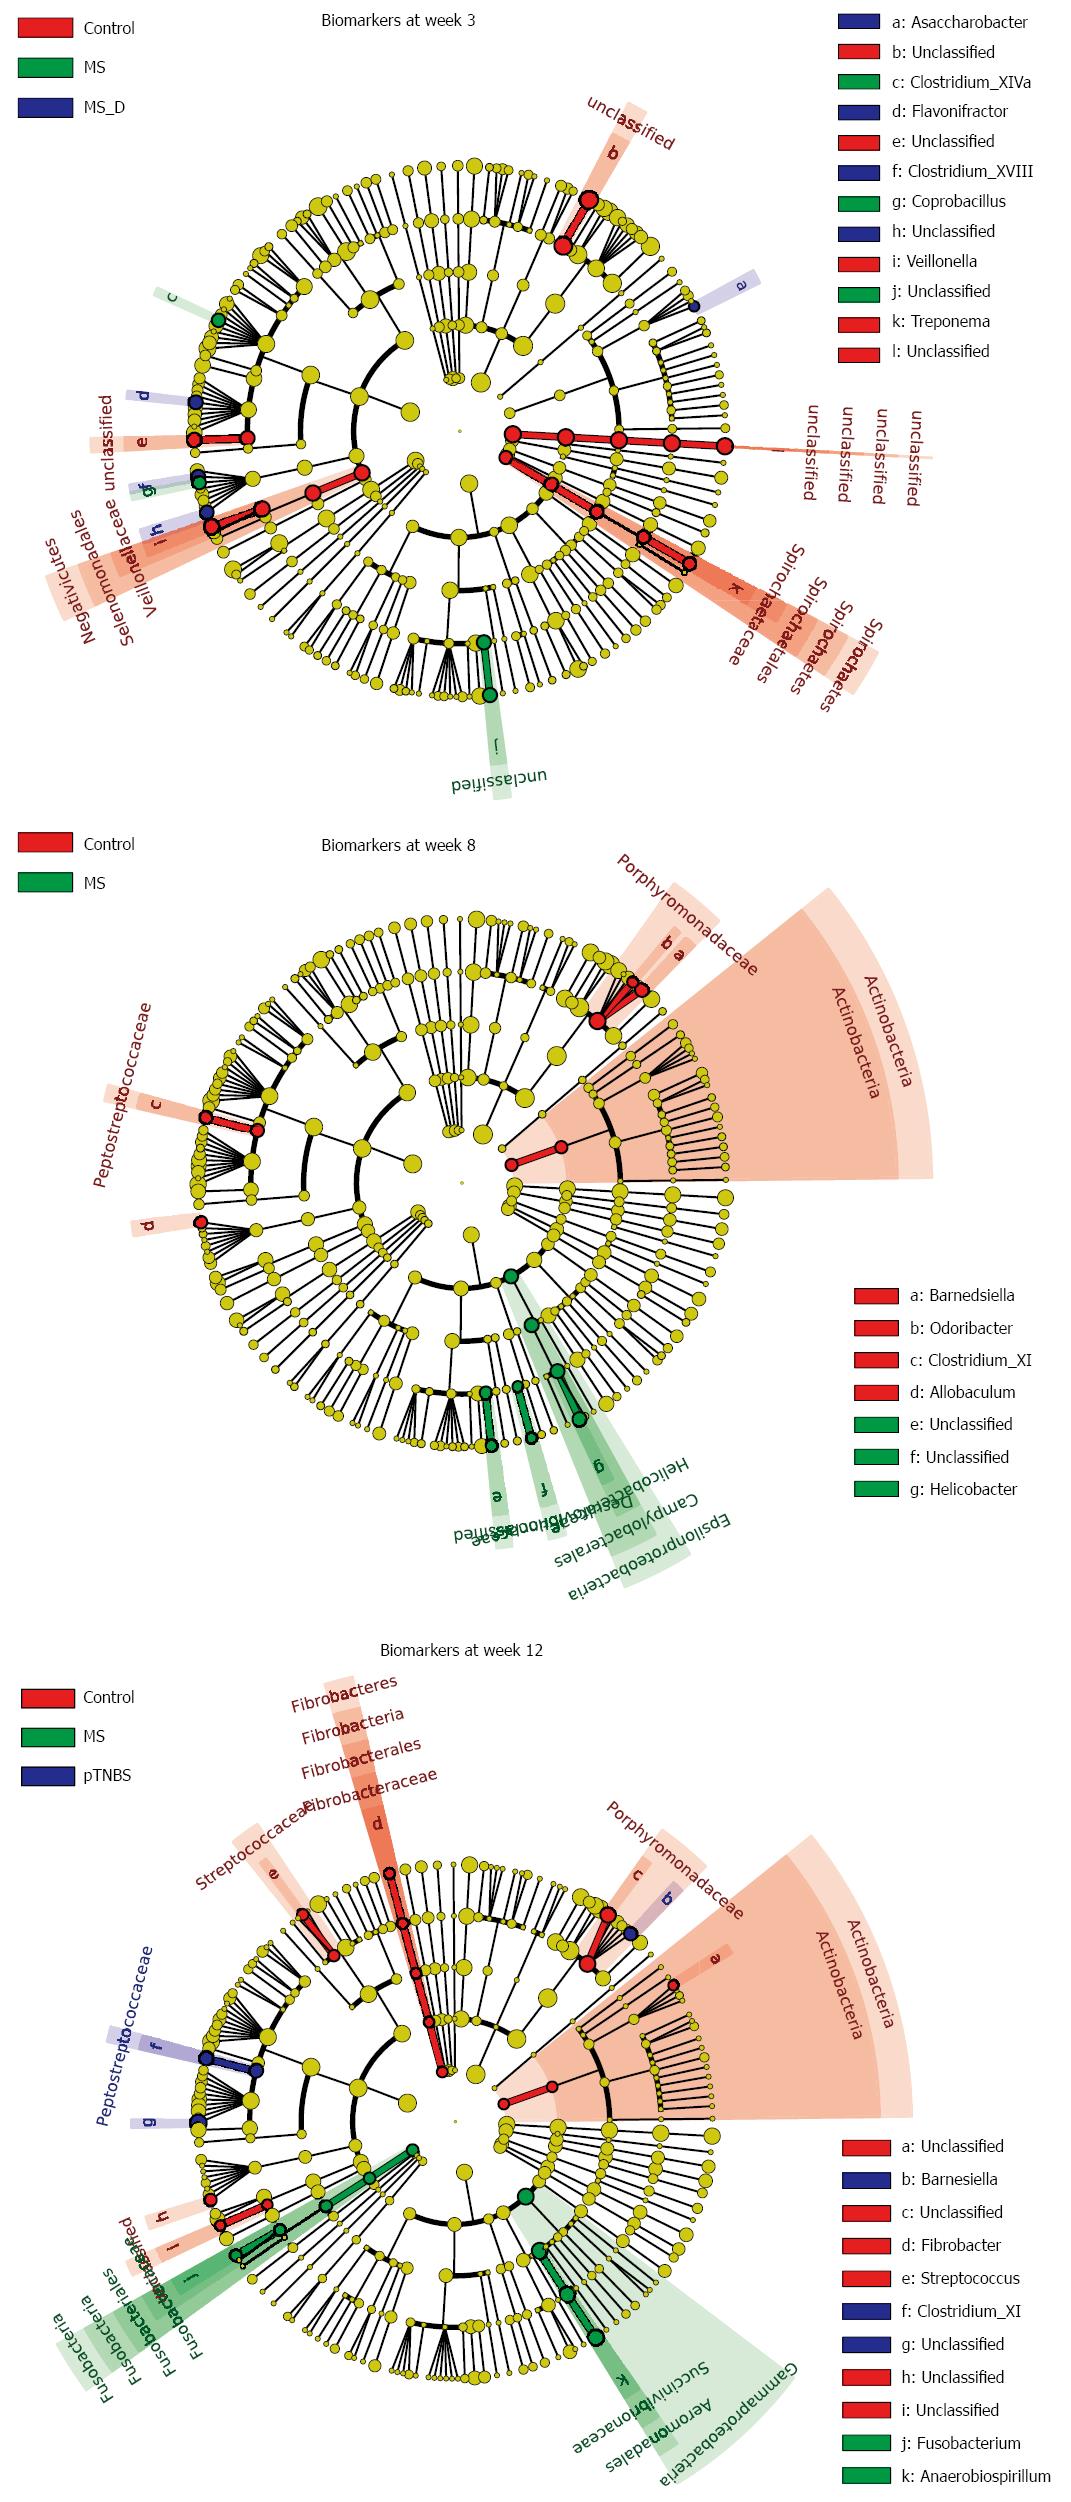
Figure 5 Microbial markers for different groups at weeks 3, 8 and 12.
Biomarkers for each time point were calculated using the LEfSe Method. The abundances of taxa at the phylum, class, order, family, and genus levels were compared between the groups. Taxa with different abundances between groups and with an LDA score larger than 2.0 were considered to be a biomarker; biomarkers were indicated with corresponding colors on the cladogram. See also Figure S1, S2, and S3. MS: Maternal separation; MS_D: MS early death; pTNBS: TNBS post-inflammatory.
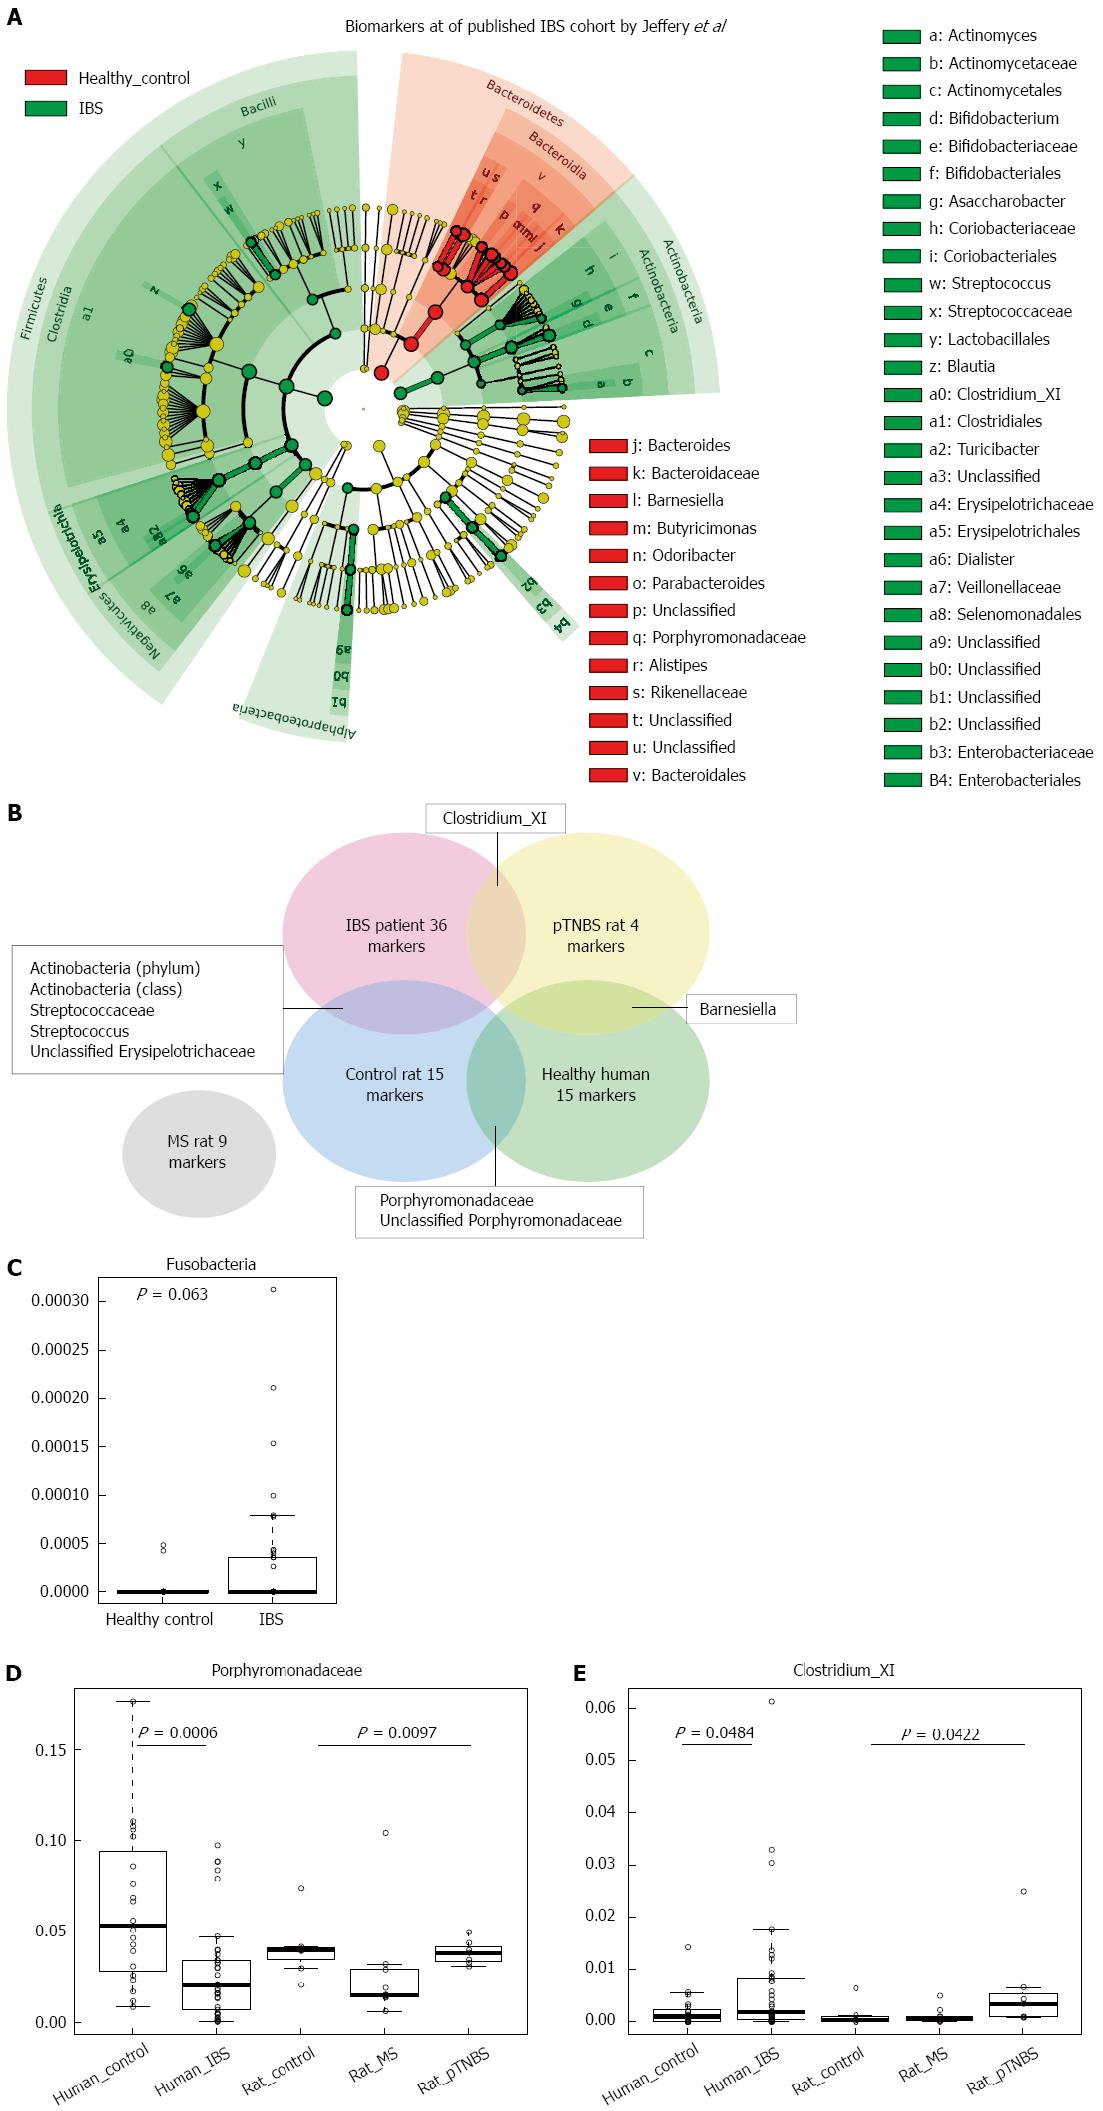
Figure 6 Comparing rat model dysbiosis to that of Jeffery’s human irritable bowel syndrome cohort.
A: Cladogram indicates the biomarkers of different abundances between groups; B: Venn plot of the positive (increased) biomarkers shared by rat models and Jeffery’s human IBS cohort. The overlapped area indicates that the two groups have common biomarkers. The MS rat does not share biomarkers from the human cohort; C: Abundance of the Fusobacteria phylum marginally increased in the human IBS cohort; D: Abundance of Porphyromonadaceae in fecal samples of healthy human controls, human IBS patients, control rats, MS rats, and pTNBS rats. Porphyromonadaceae was depleted in both the human IBS group and the MS rats; E: Abundance of Clostridium XI in fecal samples of healthy human controls, healthy IBS patients, control rats, MS rats, and pTNBS rats. Clostridium XI increased in both human IBS patients and pTNBS rats. IBS: Irritable bowel syndrome; MS: Maternal separation; pTNBS: TNBS post-inflammatory.
- Citation: Zhou XY, Li M, Li X, Long X, Zuo XL, Hou XH, Cong YZ, Li YQ. Visceral hypersensitive rats share common dysbiosis features with irritable bowel syndrome patients. World J Gastroenterol 2016; 22(22): 5211-5227
- URL: https://www.wjgnet.com/1007-9327/full/v22/i22/5211.htm
- DOI: https://dx.doi.org/10.3748/wjg.v22.i22.5211


