Copyright
©The Author(s) 2016.
World J Gastroenterol. Jun 14, 2016; 22(22): 5211-5227
Published online Jun 14, 2016. doi: 10.3748/wjg.v22.i22.5211
Published online Jun 14, 2016. doi: 10.3748/wjg.v22.i22.5211
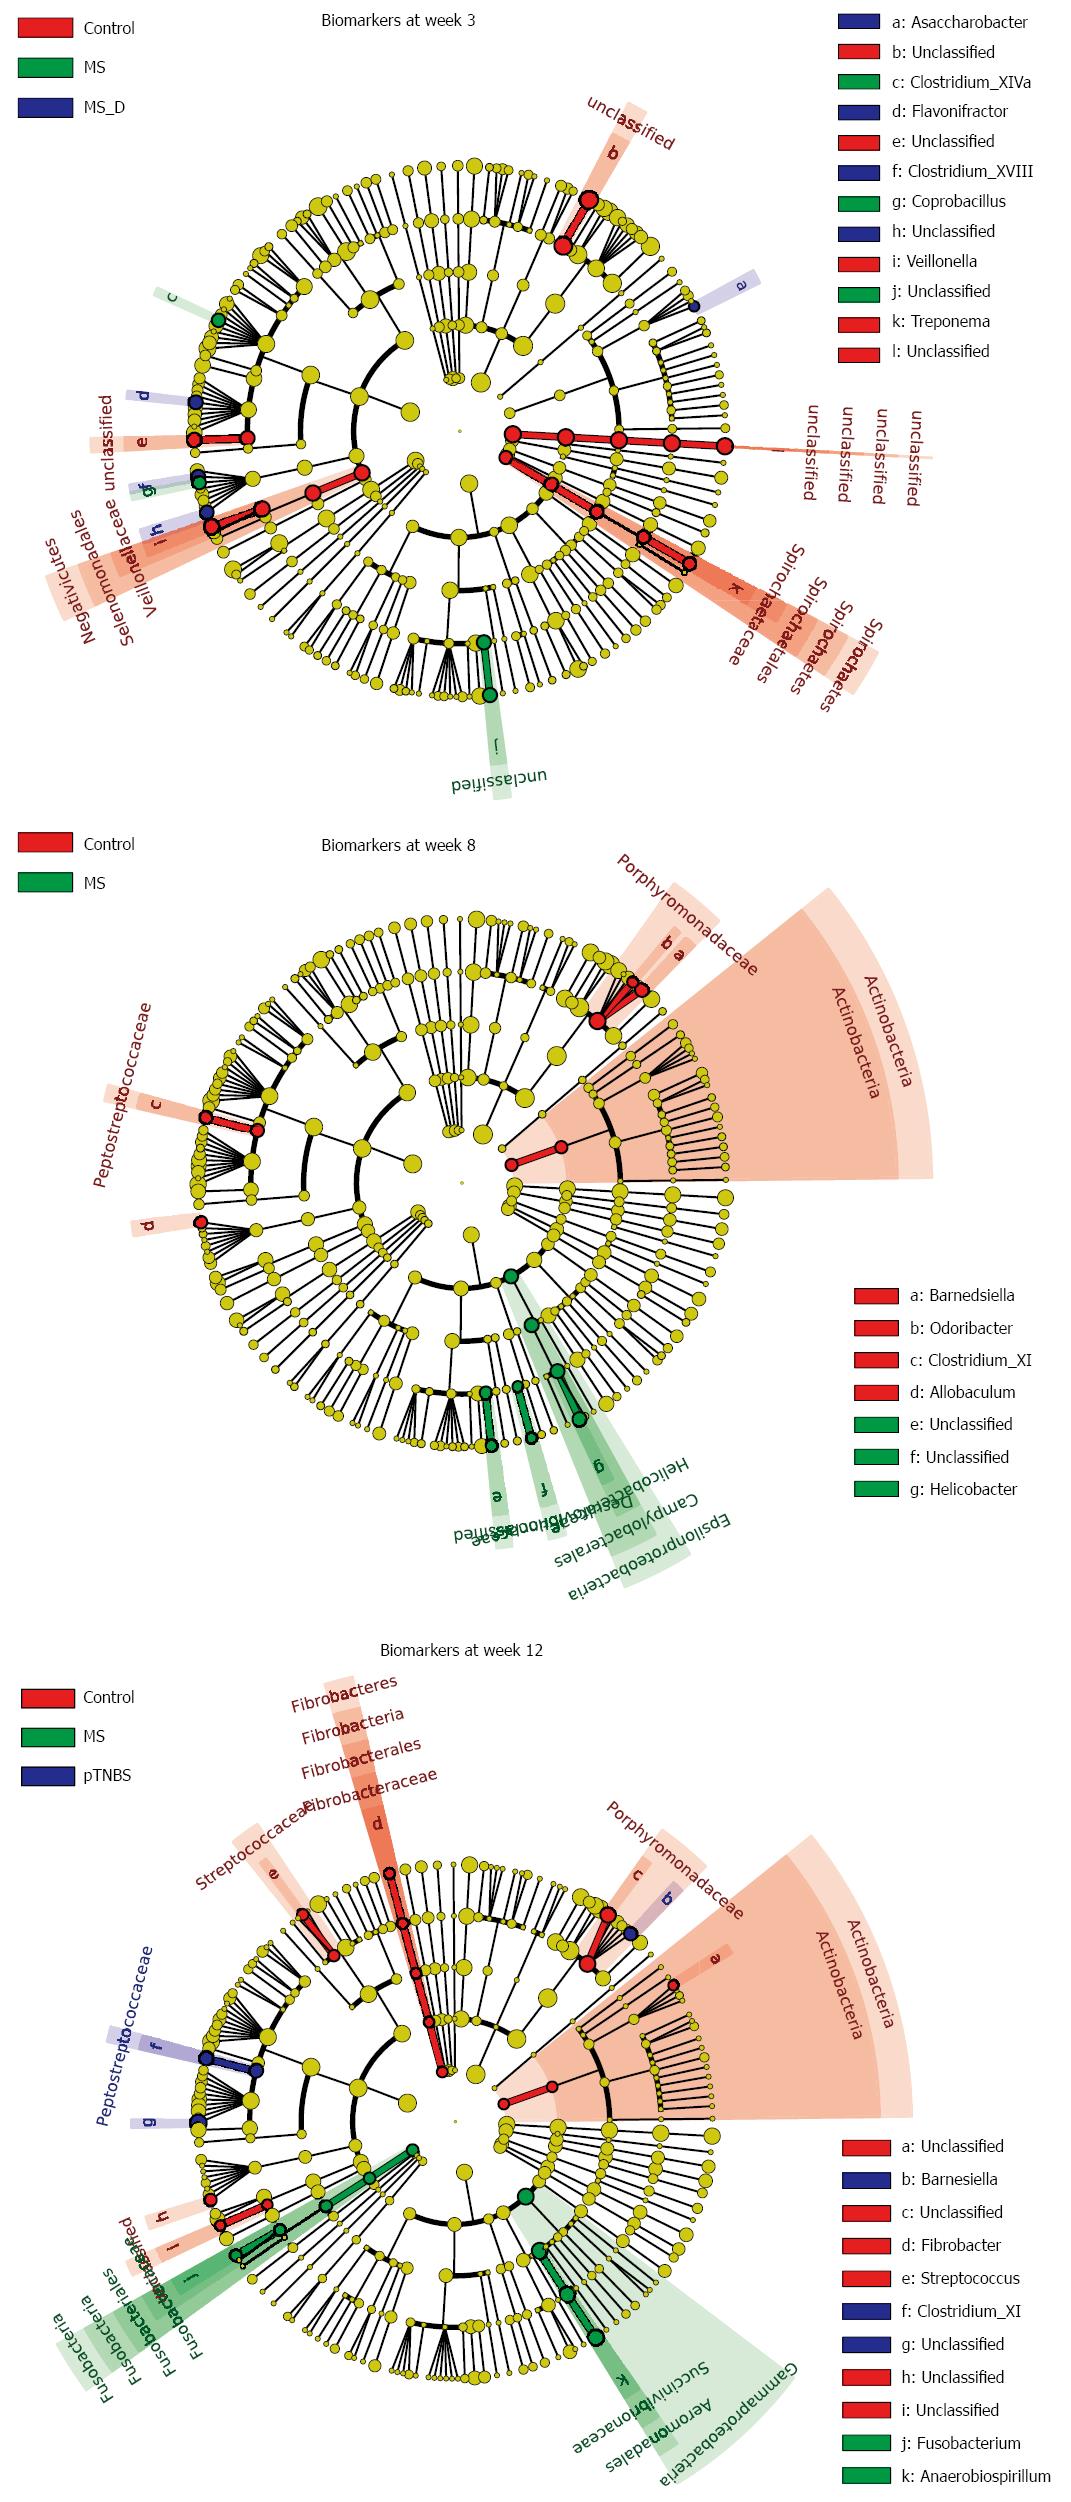
Figure 5 Microbial markers for different groups at weeks 3, 8 and 12.
Biomarkers for each time point were calculated using the LEfSe Method. The abundances of taxa at the phylum, class, order, family, and genus levels were compared between the groups. Taxa with different abundances between groups and with an LDA score larger than 2.0 were considered to be a biomarker; biomarkers were indicated with corresponding colors on the cladogram. See also Figure S1, S2, and S3. MS: Maternal separation; MS_D: MS early death; pTNBS: TNBS post-inflammatory.
- Citation: Zhou XY, Li M, Li X, Long X, Zuo XL, Hou XH, Cong YZ, Li YQ. Visceral hypersensitive rats share common dysbiosis features with irritable bowel syndrome patients. World J Gastroenterol 2016; 22(22): 5211-5227
- URL: https://www.wjgnet.com/1007-9327/full/v22/i22/5211.htm
- DOI: https://dx.doi.org/10.3748/wjg.v22.i22.5211


