Copyright
©The Author(s) 2016.
World J Gastroenterol. Jun 7, 2016; 22(21): 5096-5103
Published online Jun 7, 2016. doi: 10.3748/wjg.v22.i21.5096
Published online Jun 7, 2016. doi: 10.3748/wjg.v22.i21.5096
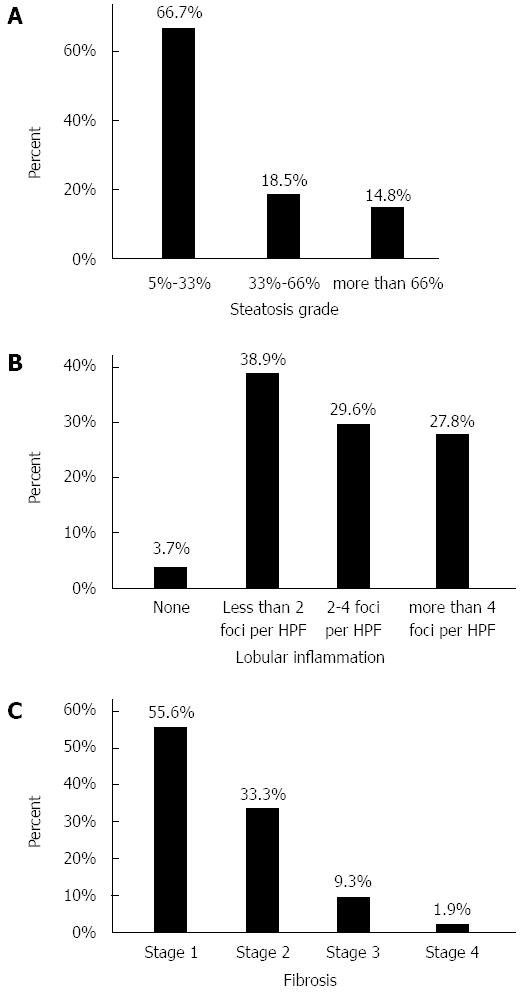
Figure 1 Frequency of histological findings in the participants.
Frequency of patients with different degrees of steatosis (A), lobular inflammation grade based on foci of lobular inflammation in high power field of microscopic view (B), and fibrosis stage (C) are presented.
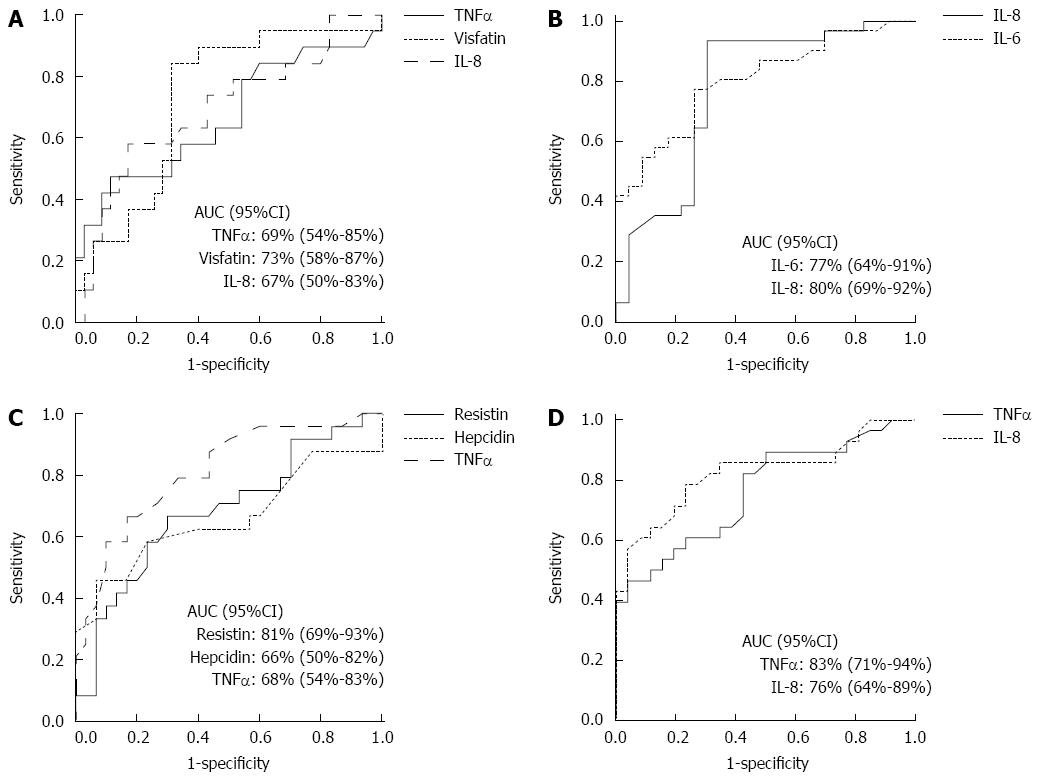
Figure 2 Receiver operating characteristic analysis to determine cut-off values of serum adipokines for differentiating histological severity.
A: ROC curve of serum TNF-α, Visfatin, and IL-8 levels to differentiate steatosis degree of less than 33% from more advanced degrees of steatosis; B: ROC curve of serum IL-6 and IL-8 levels to differentiate lobular inflammation grade of less than two foci per high power field from more advanced grades of inflammation; C: ROC curve of serum Resistin, Hepcidin, and TNF-α levels to differentiate fibrosis stage of perisinusoidal or periportal from more advanced stages of fibrosis; D: ROC curve of serum TNF-α and IL-8 levels to differentiate steatohepatitis from simple fatty liver based on non-alcoholic fatty liver disease activity score. AUC: Area under curve; IL: Interleukin.
- Citation: Jamali R, Razavizade M, Arj A, Aarabi MH. Serum adipokines might predict liver histology findings in non-alcoholic fatty liver disease. World J Gastroenterol 2016; 22(21): 5096-5103
- URL: https://www.wjgnet.com/1007-9327/full/v22/i21/5096.htm
- DOI: https://dx.doi.org/10.3748/wjg.v22.i21.5096


