Copyright
©The Author(s) 2016.
World J Gastroenterol. Jun 7, 2016; 22(21): 5096-5103
Published online Jun 7, 2016. doi: 10.3748/wjg.v22.i21.5096
Published online Jun 7, 2016. doi: 10.3748/wjg.v22.i21.5096
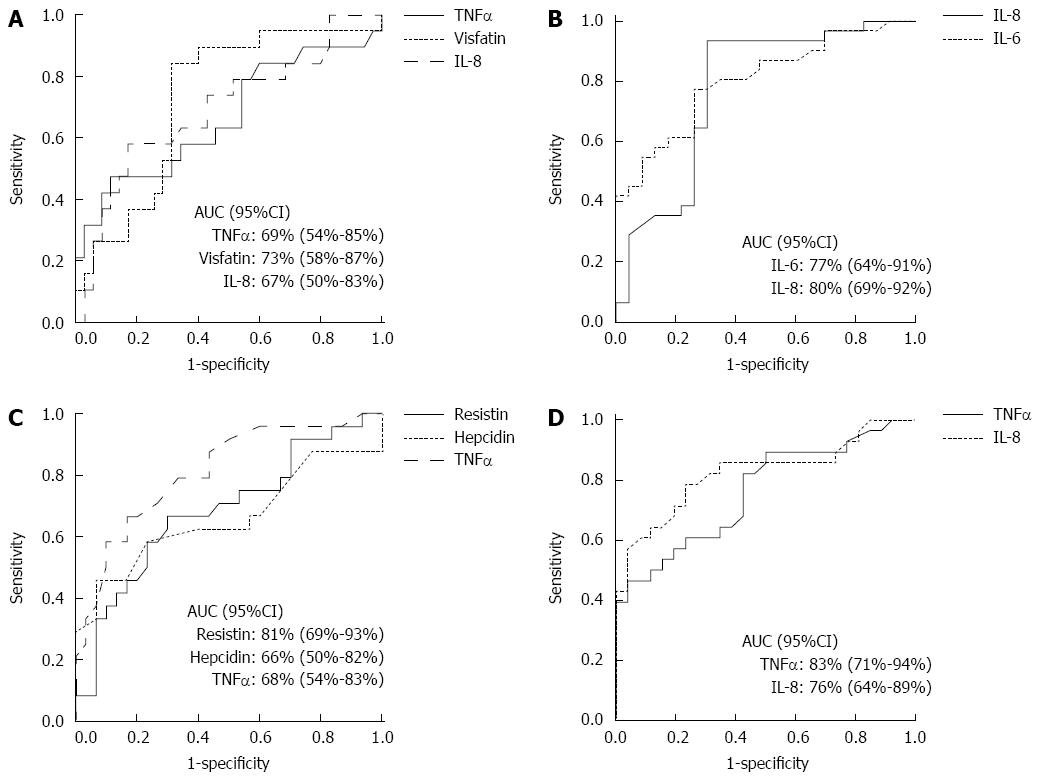
Figure 2 Receiver operating characteristic analysis to determine cut-off values of serum adipokines for differentiating histological severity.
A: ROC curve of serum TNF-α, Visfatin, and IL-8 levels to differentiate steatosis degree of less than 33% from more advanced degrees of steatosis; B: ROC curve of serum IL-6 and IL-8 levels to differentiate lobular inflammation grade of less than two foci per high power field from more advanced grades of inflammation; C: ROC curve of serum Resistin, Hepcidin, and TNF-α levels to differentiate fibrosis stage of perisinusoidal or periportal from more advanced stages of fibrosis; D: ROC curve of serum TNF-α and IL-8 levels to differentiate steatohepatitis from simple fatty liver based on non-alcoholic fatty liver disease activity score. AUC: Area under curve; IL: Interleukin.
- Citation: Jamali R, Razavizade M, Arj A, Aarabi MH. Serum adipokines might predict liver histology findings in non-alcoholic fatty liver disease. World J Gastroenterol 2016; 22(21): 5096-5103
- URL: https://www.wjgnet.com/1007-9327/full/v22/i21/5096.htm
- DOI: https://dx.doi.org/10.3748/wjg.v22.i21.5096


