Copyright
©The Author(s) 2016.
World J Gastroenterol. May 28, 2016; 22(20): 4881-4890
Published online May 28, 2016. doi: 10.3748/wjg.v22.i20.4881
Published online May 28, 2016. doi: 10.3748/wjg.v22.i20.4881
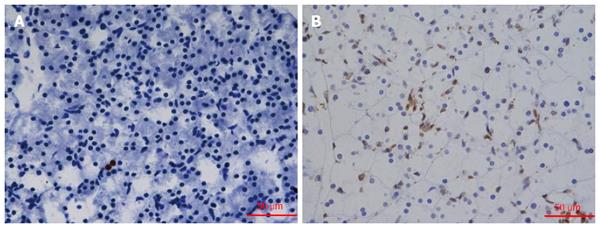
Figure 1 TUNEL staining of pancreatic tissue (× 400).
TUNEL-positive cells displayed brown fluorescence. A: TUNEL staining was detected in control rats; B: The tissue of the L-arginine treated rats. The apoptosis increased significantly in Figure 1B.
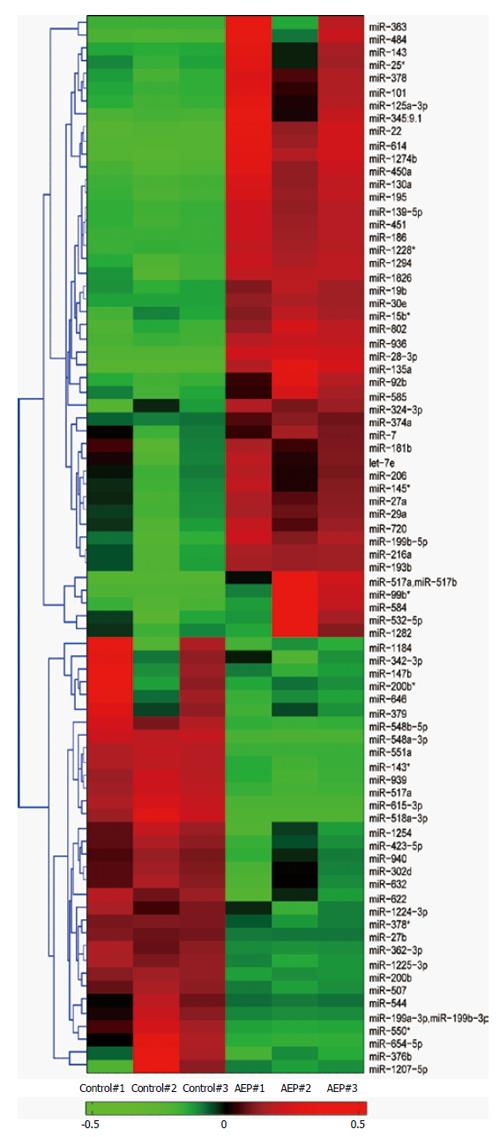
Figure 2 Hierarchically clustered heat map illustrating the changes in miRNA expression profiles between the acute edematous pancreatitis groups and control groups.
The significantly expressed miRNA clusters were identified using the Student’s t-test. The red and green sections represent an increase and a decrease in miRNA expression, respectively, between control group and AEP group. The expression of miR-29a was significantly up-regulated in the AEP group compared with the control group. AEP: Acute edematous pancreatitis.
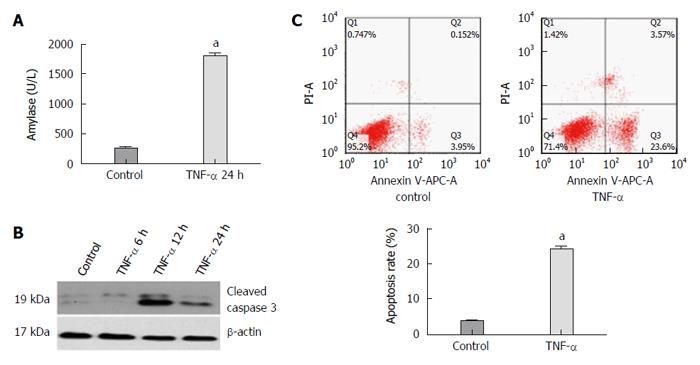
Figure 3 Expression of amylase, activated caspase 3 protein, apoptosis rate of AR42J cells and miR-29a level increase in the experimental group compared with the control group.
A: The expression of amylase analysis in the supernatant; B: Western blot analysis of activated caspase 3 in AR42J cells; C: The apoptosis rate of AR42J cells after the treatment with TNF-α for 24 h. Date were obtained from three independent experiments in triplicate and are shown as the mean ± SD. aP < 0.05 vs control group.
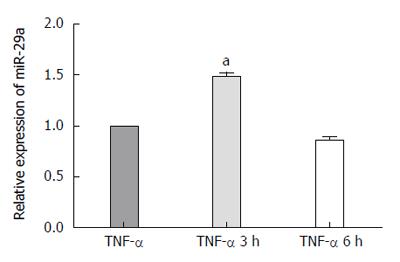
Figure 4 Quantitative real-time PCR analysis of miR-29a in AR42J cells at 3 h and 6 h.
The expression of miR-29a was normalized to U6 expression using 2-ΔΔct. Data were obtained from three independent experiments in triplicate and are shown as the mean ± SD. aP < 0.05 vs control group.
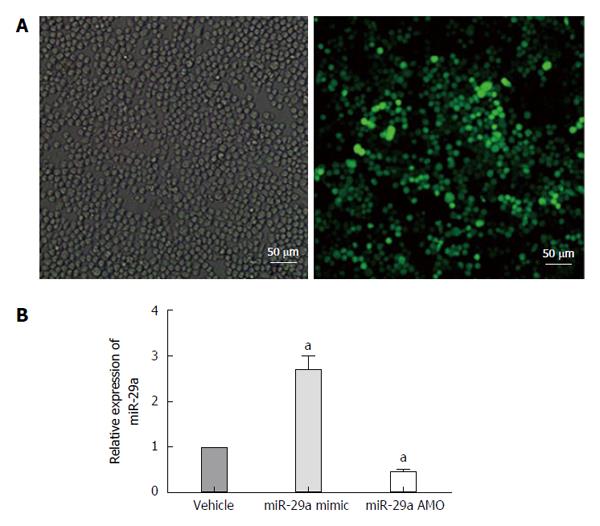
Figure 5 Lentiviral transfection and miRNA expression after transfection.
A: Cells were infected with 50 MOI of lentivirus, and imaged 72 h post-transfection. Comparison of bright field filter view to FITC filter view (GFP-expression cells) for the same fields of cells showed about 90% infection efficiency by 72 h; B: Quantitative real-time PCR analysis of miR-29a expression in the AR42J cells after transfection. Date are shown as a ratio of mi-29a mimic and AMO groups to vehicle groups using the 2-ΔΔct. Data are representative of three independent experiments. aP < 0.05 vs vehicle group.
Figure 6 miR-29a promotes the apoptosis of the AR42J cells.
A: The amylase analysis in the supernatant increased obviously; B: Western blot analysis of activated caspase 3 in AR42J cells; C: The apoptosis rate of AR42J cells was determined by FACS analysis. Data are representative of mean ± SD from three independent experiments performed in triplicate. aP < 0.05 vs control or vehicle group.
Figure 7 miR-29a targets TNFRSF1A.
A: The predicted miR-29a binding sites within the 3’UTR of TNFRSF1A and mutant version generated by site mutagenesis are shown; B: Luciferase activity was determined 48 h after transfection. The ratio of normalized sensor to control luciferase activity is shown. Data are shown as the mean ± SD and were obtained from three independent experiments performed in triplicate (aP < 0.05 vs control miR-transfected cells).
Figure 8 miR-29a promotes TNFRSF1A gene expression.
A: Quantitative real-time RT-PCR analysis of TNFRSF1A expression in AR42J cells after transfection. Date are shown as a ratio of miR-29a mimic and AMO groups to vehicle group using the 2-ΔΔct. Data are representative of three independent experiments (aP < 0.05 vs vehicle group); B: Western blot analysis of TNFR1 protein in AR42J cells after transfection.
- Citation: Fu Q, Qin T, Chen L, Liu CJ, Zhang X, Wang YZ, Hu MX, Chu HY, Zhang HW. miR-29a up-regulation in AR42J cells contributes to apoptosis via targeting TNFRSF1A gene. World J Gastroenterol 2016; 22(20): 4881-4890
- URL: https://www.wjgnet.com/1007-9327/full/v22/i20/4881.htm
- DOI: https://dx.doi.org/10.3748/wjg.v22.i20.4881


