Copyright
©The Author(s) 2016.
World J Gastroenterol. May 21, 2016; 22(19): 4707-4715
Published online May 21, 2016. doi: 10.3748/wjg.v22.i19.4707
Published online May 21, 2016. doi: 10.3748/wjg.v22.i19.4707
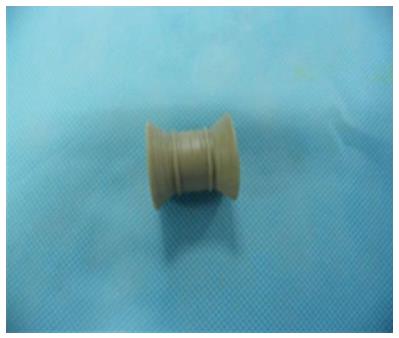
Figure 1 Appearance of degradable stent.
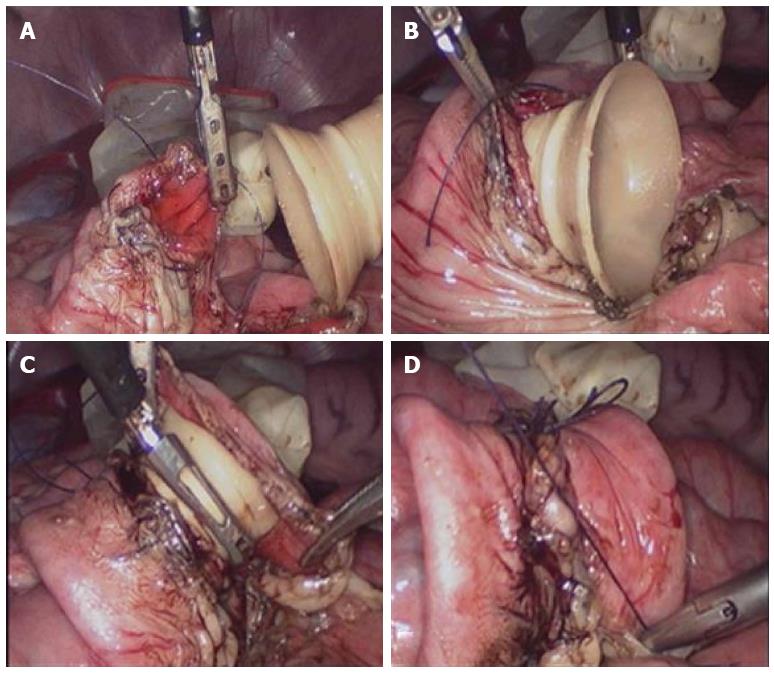
Figure 2 Operative procedure in the stent group.
A: A purse-string suture was performed circularly around the intestine; B: One end of the stent was embedded in one side of the intestinal cavity, and the purse string was tightened, knotted, and fixed; C: The other side of the stent was placed in the contralateral intestinal cavity, and the purse string was tightened, knotted, and fixed; D: Both sides of the purse-string were knotted and fixed.
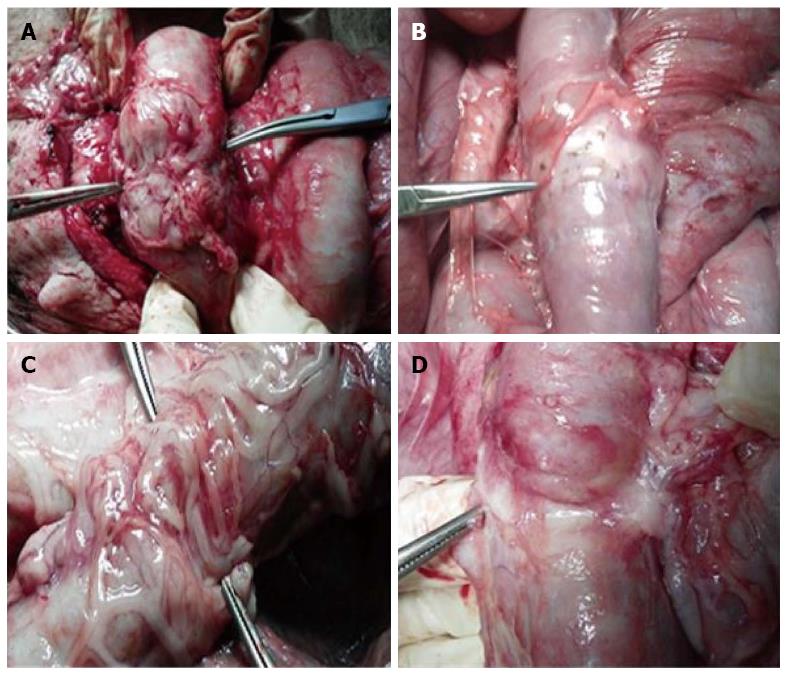
Figure 3 General observation of the anastomosis.
A: Stent group at postoperative week 2; B: Stent group at postoperative month 3; C: Control group at postoperative week 2; D: Control group at postoperative month 3.
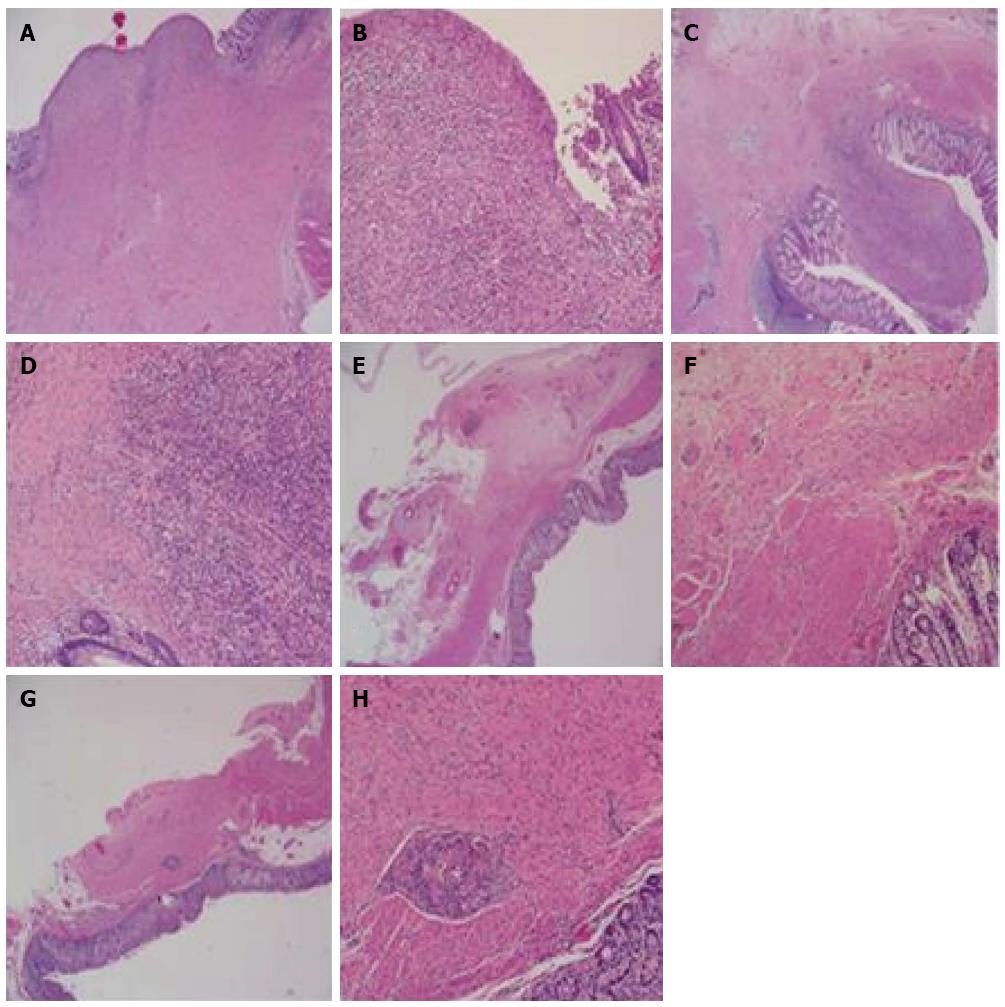
Figure 4 Hematoxylin and eosin staining of anastomosis.
A, B: Hematoxylin and eosin (HE) staining of the stent group at 2 wk postoperatively (× 100, × 200); C, D: HE staining of the control group at 2 wk postoperatively (× 100, × 200); E, F: HE staining of the stent group at 3 mo postoperatively (× 100, × 200); G, H: HE staining of the control group at 3 mo postoperatively (× 100, × 200).
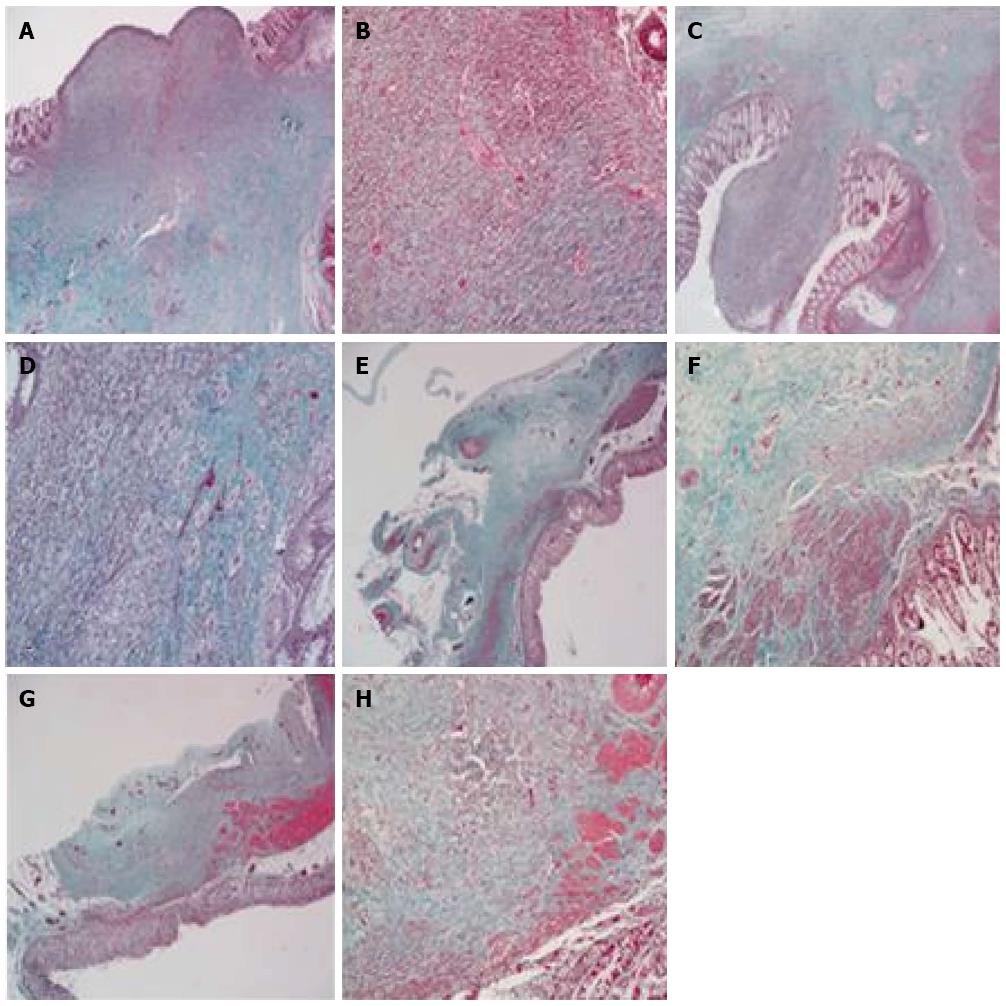
Figure 5 Masson’s trichrome staining of anastomosis.
A, B: Masson’s trichrome staining of the stent group at 2 wk postoperatively (× 100, × 200); C, D: Masson’s trichrome staining of the control group at 2 wk postoperatively (× 100, × 200); E, F: Masson’s trichrome staining of the stent group at 3 mo postoperatively (× 100, × 200); G, H: Masson’s trichrome staining of the control group at 3 mo postoperatively (× 100, × 200). The hyperplastic fibrous tissue and collagenous fibers are shown with green or blue, while hyperplastic smooth muscle cells with red.
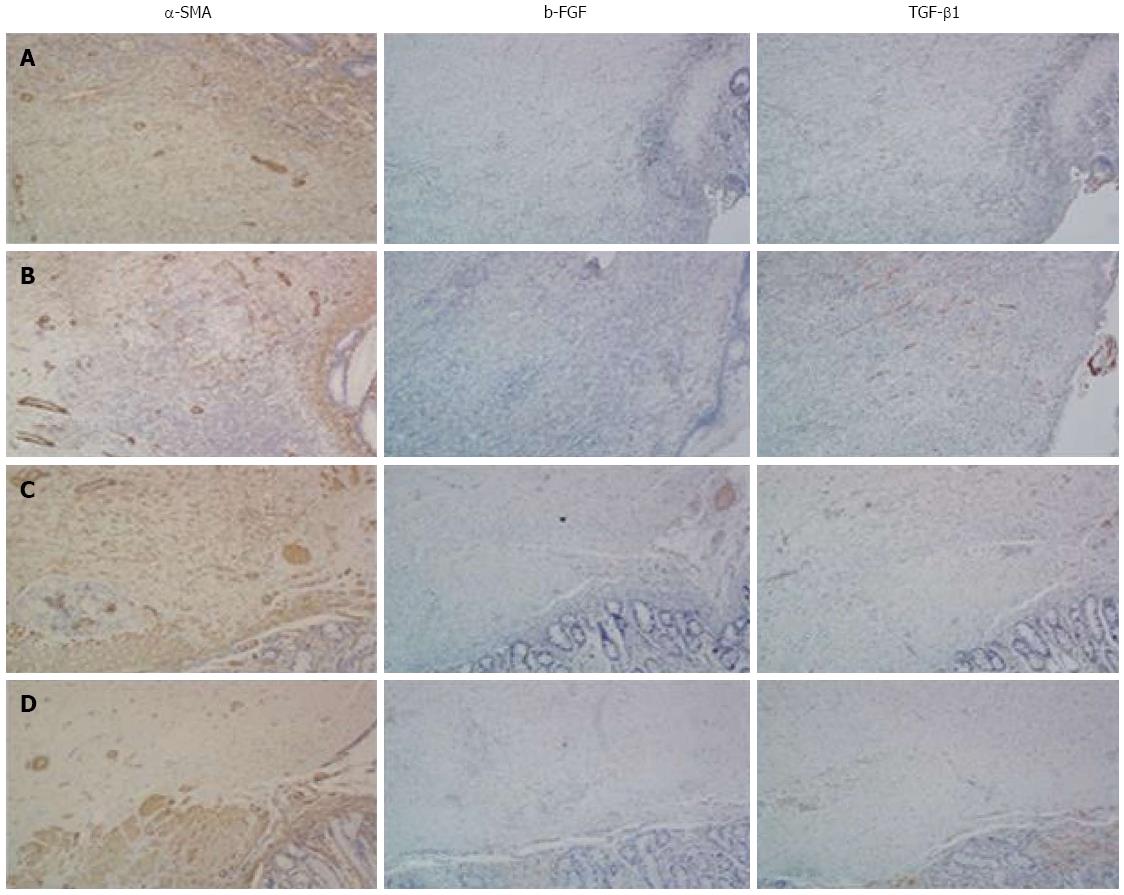
Figure 6 Immunohistochemical staining of anastomosis.
A: Immunohistochemical staining for α-SMA, b-FGF, and TGF-β1 of the stent group at 2 wk postoperatively; B: Immunohistochemical staining for α-SMA, b-FGF and TGF-β1 of the control group at 2 wk postoperatively; C: Immunohistochemical staining for α-SMA, b-FGF and TGF-β1 of the stent group at 3 mo postoperatively; D: Immunohistochemical staining for α-SMA, b-FGF and TGF-β1 in the control group at 3 mo postoperatively (all × 200). α-SMA: α-smooth muscle actin; b-FGF: Basic fibroblast growth factor; TGF: Transforming growth factor.
- Citation: Ma L, Cai XJ, Wang HH, Yu YL, Huang DY, Ge GJ, Hu HY, Yu SC. Laparoscopic colonic anastomosis using a degradable stent in a porcine model. World J Gastroenterol 2016; 22(19): 4707-4715
- URL: https://www.wjgnet.com/1007-9327/full/v22/i19/4707.htm
- DOI: https://dx.doi.org/10.3748/wjg.v22.i19.4707


