Copyright
©The Author(s) 2016.
World J Gastroenterol. May 7, 2016; 22(17): 4397-4402
Published online May 7, 2016. doi: 10.3748/wjg.v22.i17.4397
Published online May 7, 2016. doi: 10.3748/wjg.v22.i17.4397
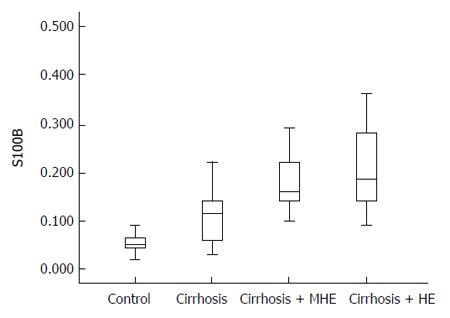
Figure 1 Serum concentrations of S100β (ng/mL) among groups.
(1) Healthy subjects [0.05 (0.04-0.07)]; (2) Cirrhosis without HE [0.11 (0.06-0.14)]; (3) Cirrhosis with covert HE [0.16 (0.13-0.23)]; (4) Cirrhosis with overt HE [0.18 (0.14-0.28)]. Group 1 vs group 2, P < 0.001; Group 2 vs group 3, P < 0.016; Group 3 vs 4, P = 0.508. Healthy subjects vs all groups [0.14 (0.098-0.198)], P < 0.001.
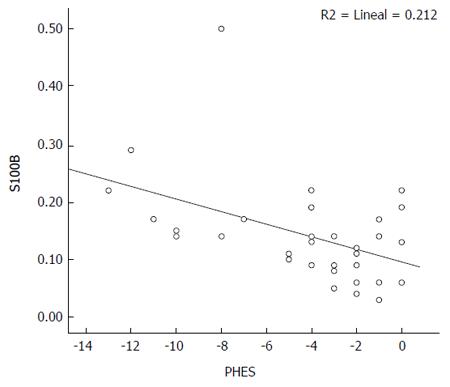
Figure 2 S100β and PHES correlations between patients with cirrhosis and covert HE and non-covert HE.
r = -0.413, P = 0.019. HE: Hepatic encephalopathy; PHES: Psychometric hepatic encephalopathy score.
- Citation: Duarte-Rojo A, Ruiz-Margáin A, Macias-Rodriguez RU, Cubero FJ, Estradas-Trujillo J, Muñoz-Fuentes RM, Torre A. Clinical scenarios for the use of S100β as a marker of hepatic encephalopathy. World J Gastroenterol 2016; 22(17): 4397-4402
- URL: https://www.wjgnet.com/1007-9327/full/v22/i17/4397.htm
- DOI: https://dx.doi.org/10.3748/wjg.v22.i17.4397


