Copyright
©The Author(s) 2016.
World J Gastroenterol. May 7, 2016; 22(17): 4338-4344
Published online May 7, 2016. doi: 10.3748/wjg.v22.i17.4338
Published online May 7, 2016. doi: 10.3748/wjg.v22.i17.4338
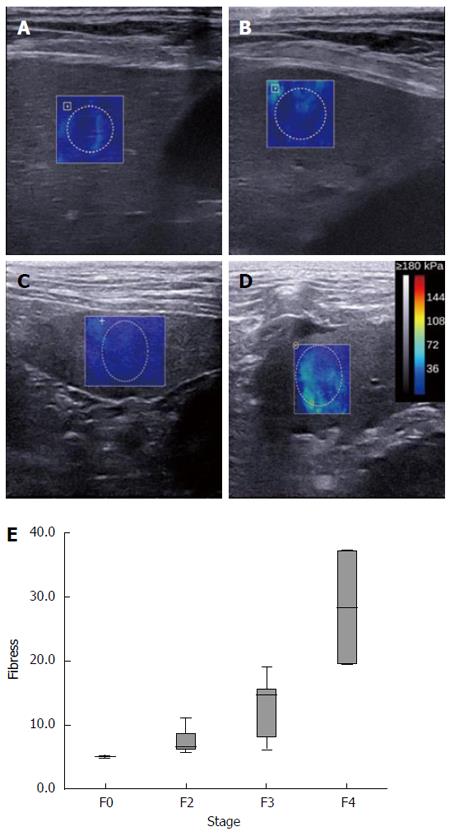
Figure 1 Correlation of shear wave elastography with fibrosis grading.
A-D: Representative shear wave elastography images for F0, F2, F3, and F4, respectively; E: Box plot of the elastic modulus (kPa) expressed as median ± IQR against fibrosis grading. IQR: Interquartile range.
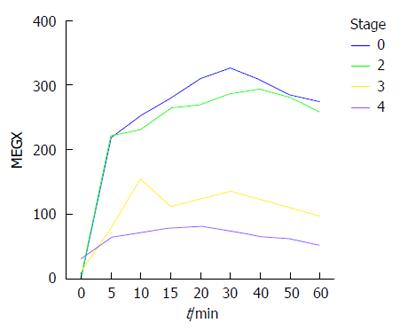
Figure 2 Plasma monoethylglycinexylidide concentration vs time plots by fibrosis grade.
MEGX: Monoethylglycinexylidide.
- Citation: Feng YH, Hu XD, Zhai L, Liu JB, Qiu LY, Zu Y, Liang S, Gui Y, Qian LX. Shear wave elastography results correlate with liver fibrosis histology and liver function reserve. World J Gastroenterol 2016; 22(17): 4338-4344
- URL: https://www.wjgnet.com/1007-9327/full/v22/i17/4338.htm
- DOI: https://dx.doi.org/10.3748/wjg.v22.i17.4338


