Copyright
©The Author(s) 2016.
World J Gastroenterol. Apr 28, 2016; 22(16): 4226-4237
Published online Apr 28, 2016. doi: 10.3748/wjg.v22.i16.4226
Published online Apr 28, 2016. doi: 10.3748/wjg.v22.i16.4226
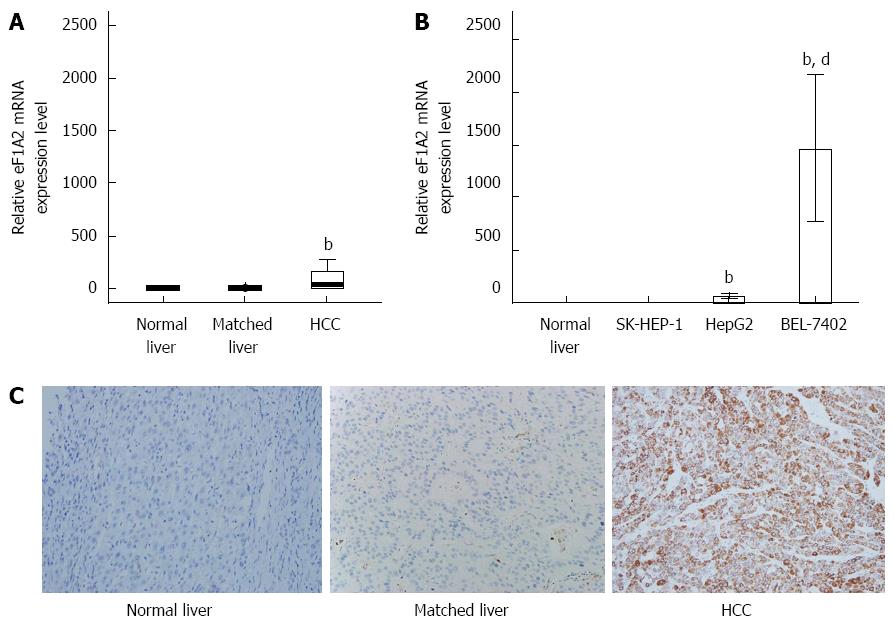
Figure 1 Relative eEF1A2 mRNA expression levels in hepatocellular carcinoma tissue samples and cells.
GAPDH was used as an internal control. Expression data were obtained as 2-ΔΔCT or -ΔΔCT relative to normal liver tissue values. A: Relative eEF1A2 mRNA expression levels in HCC tissue samples analyzed by the -ΔΔCT method. Normal liver tissue specimens (n = 20); matched liver tissue samples (n = 62); HCC tissue specimens (n = 62); B: Relative eEF1A2 mRNA expression levels in SK-HEP-1, HepG2 and BEL-7402 cells analyzed by 2-ΔΔCT method (n = 3); C: eEF1A2 protein levels in matched liver tissue and HCC tissue specimens from a HCC patient, and normal liver tissue samples were analyzed by immunohistochemistry (SP × 200). Data are mean ± SD. bP < 0.01 vs Normal liver tissue and Matched liver tissue samples. dP < 0.01 vs SK-HEP-1 and HepG2.
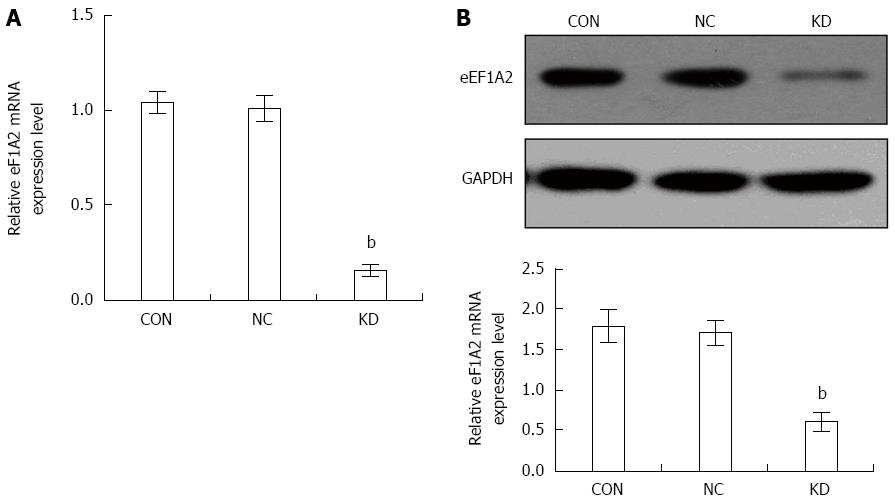
Figure 2 Effect of eEF1A2-shRNA on eEF1A2 expression in BEL-7402 cells (n = 3).
GAPDH was used as an internal control. A: Relative expression of eEF1A2 mRNA; B: eEF1A2 protein levels as detected by the Western blot method (upper, Western blot; lower, quantification of Western blot normalized by GADPH). Data are mean ± SD (n = 3). bP < 0.01 vs NC and CON. CON: Blank control group not infected; NC: Negative control group infected with GV115-LV; KD: eEF1A2 RNAi group infected with GV115-eEF1A2-shRNA-LV.
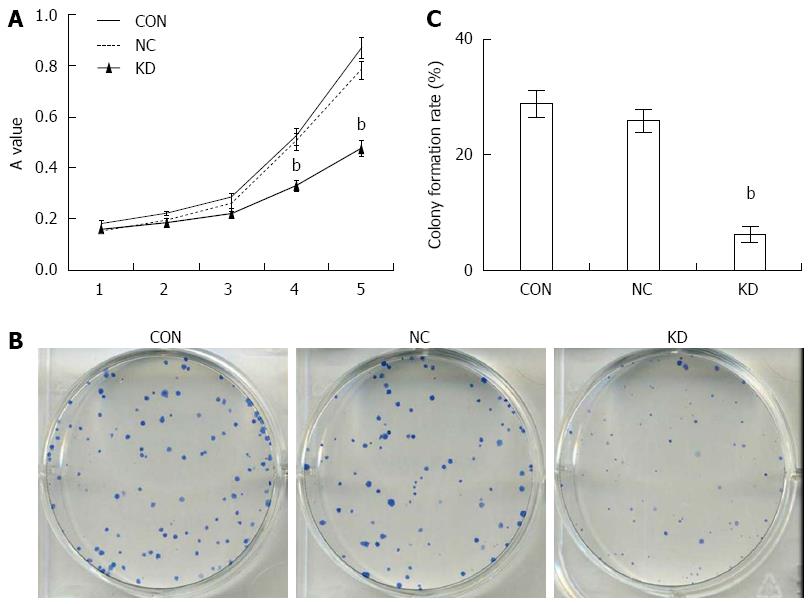
Figure 3 Effect of eEF1A2-shRNA on BEL-7402 cell proliferation.
A: Effect of eEF1A2-shRNA on BEL-7402 cell colony formation; B: Colony formation as detected by the Giemsa staining method (× 100); C: Colony formation rates of Bel-7402 cells. Data are mean ± SD (n = 3). bP < 0.01 vs NC and CON.
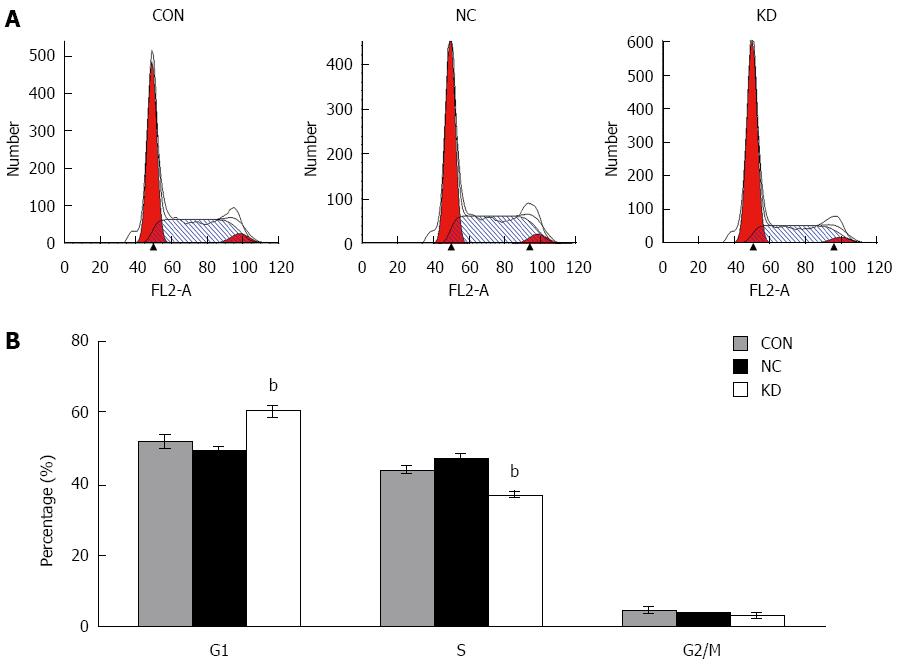
Figure 4 Effect of eEF1A2-shRNA on BEL-7402 cell cycle.
A: Cell cycle distribution detected by DNA ploidy analysis; B: Percentages of Bel-7402 cells in the G0/G1, S and G2/M phases, respectively. Data are mean ± SD (n = 3). bP < 0.01 vs NC and CON.
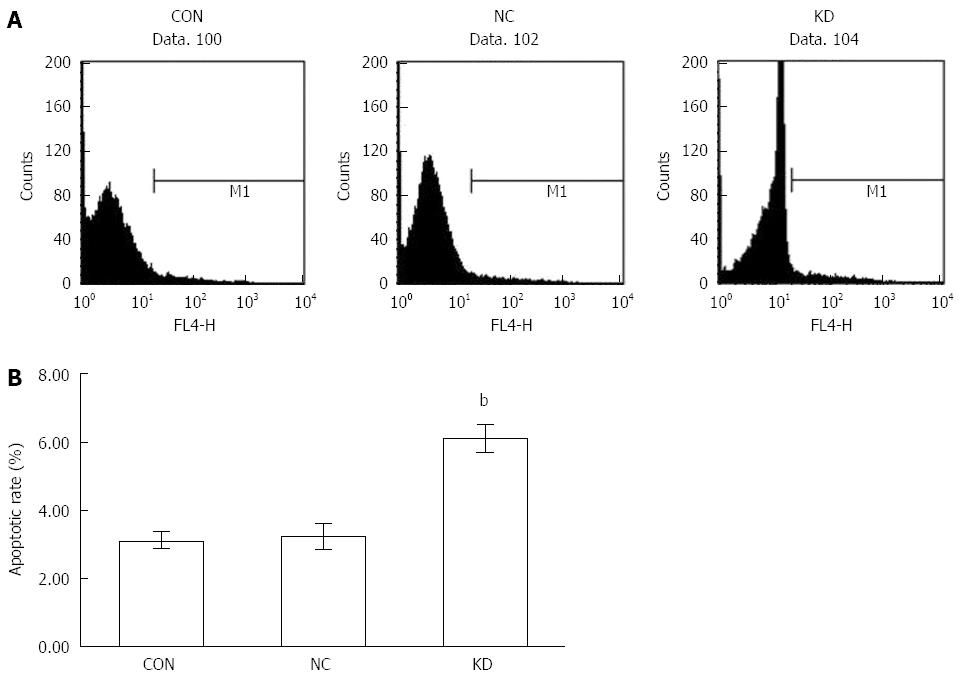
Figure 5 Effect of eEF1A2-shRNA on BEL-7402 apoptosis.
A: Flow-cytograms after Annexin V-APC staining; B: Apoptotic rates of Bel-7402 cells. Data are mean ± SD (n = 3). bP < 0.01 vs NC and CON.
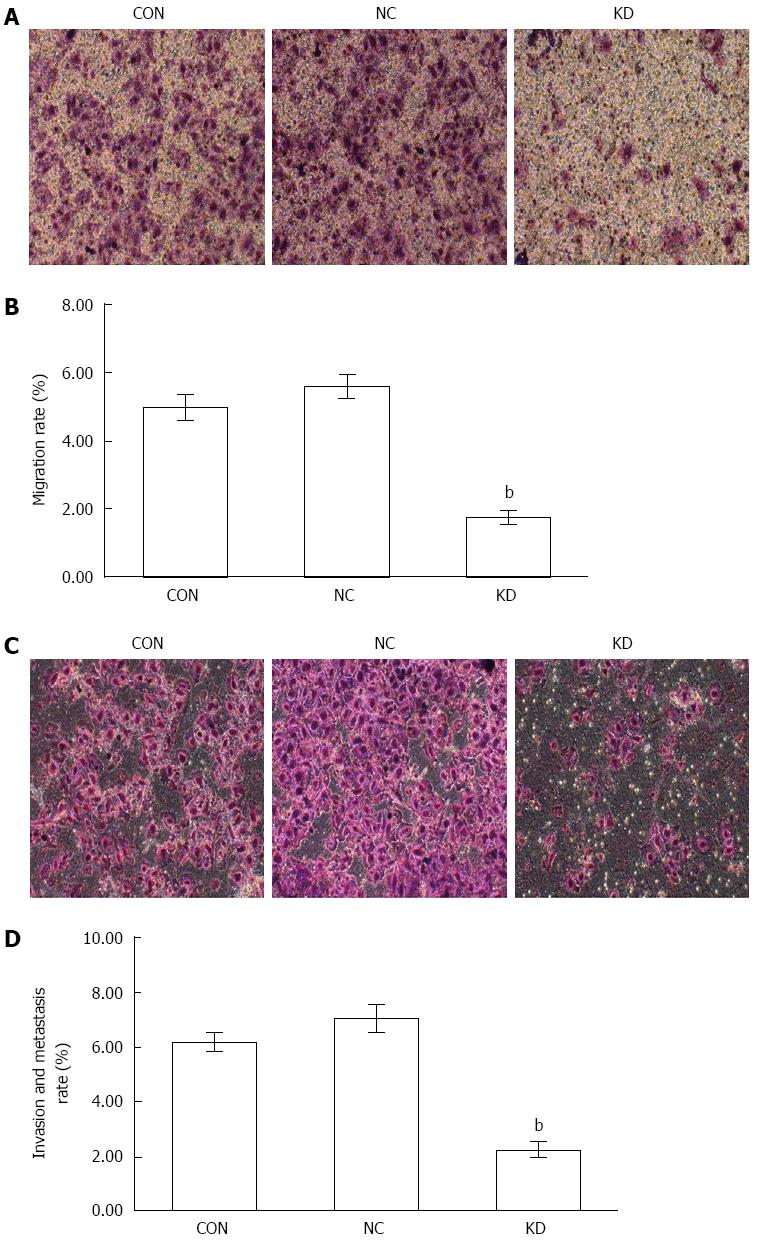
Figure 6 Effect of eEF1A2-shRNA on BEL-7402 cell migration and metastasis.
A: Cell migration as detected by the Giemsa staining method; B: Quantitation of A. Data are mean ± SD (n = 3). bP < 0.01 vs NC and CON; C: Cell invasion and metastasis as assessed by the Giemsa staining method; D: Quantitation of C. Data are mean ± SD (n = 3). bP < 0.01 vs NC and CON.
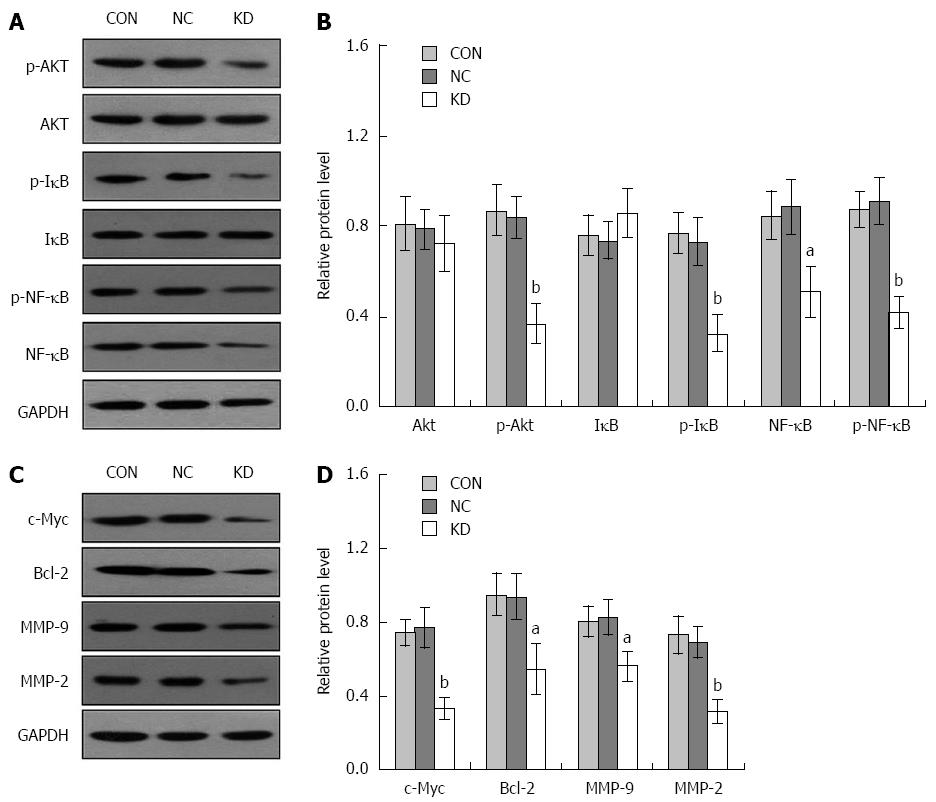
Figure 7 Effect of eEF1A2-shRNA on Akt, p-Akt, IκB, p-IκB, NF-κB, p-NF-κB, c-Myc, Bcl-2, MMP-9 and MMP-2 protein expression in BEL-7402 cells.
GAPDH was used as an internal control. A: Western blots showing Akt, p-Akt, IκB, p-IκB, NF-κB, p-NF-κB and GAPDH protein bands; B: Relative expression of Akt, p-Akt, IκB, p-IκB, NF-κB and p-NF-κB; C: Western blots showing expression of c-Myc, Bcl-2, MMP-9, MMP-2 and GAPDH protein bands; D: Relative expression of c-Myc, Bcl-2, MMP-9 and MMP-2. Data are mean ± SD (n = 3). aP < 0.05 vs NC and CON; bP < 0.01 vs NC and CON.
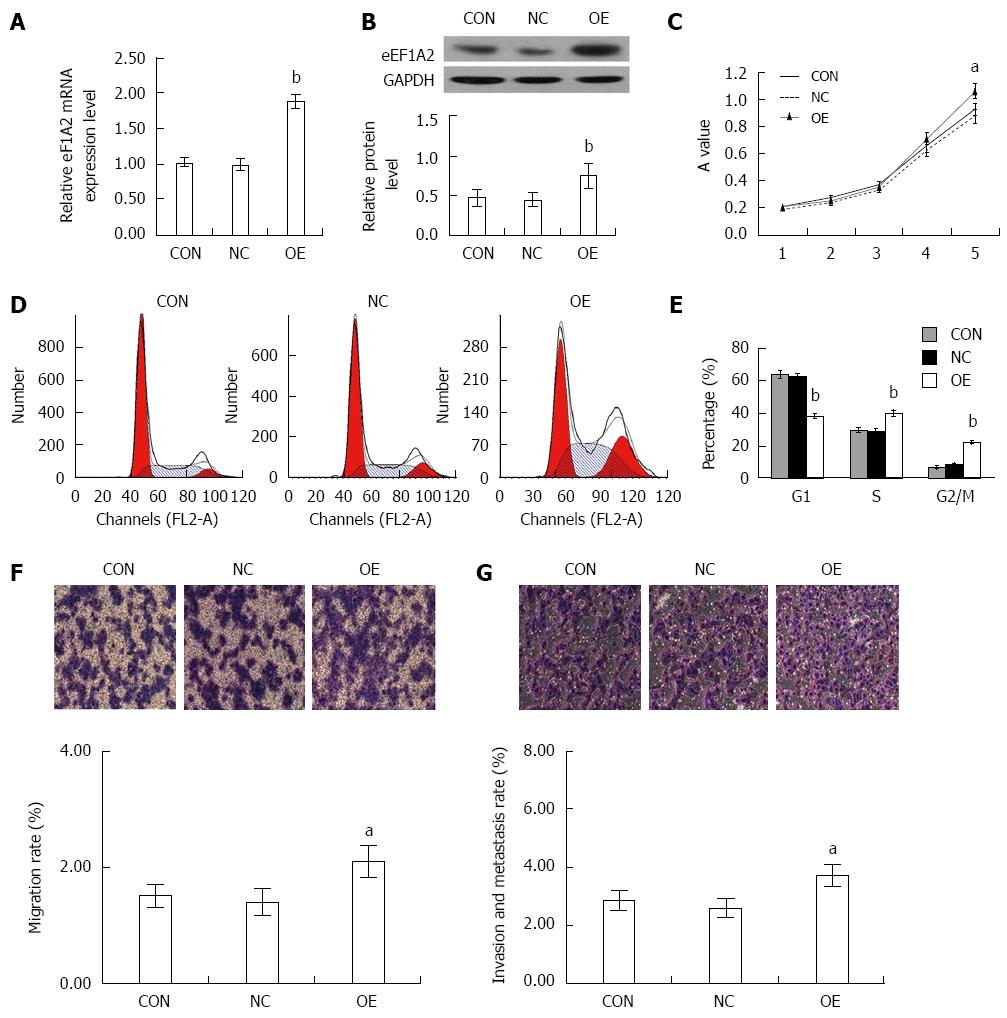
Figure 8 Overexpression of eEF1A2 promotes the proliferation, migration and invasion of SK-HEP-1 cells.
SK-HEP-1 cells were infected with the negative lentivirus (NC), without lentivirus transfection (CON), or lentivirus-based eEF1A2 overexpression (OE). A: qRT–PCR; B: Western blot analysis confirmed the expression of eEF1A2 in the SK-HEP-1 cells; C: eEF1A2 promoted the proliferation of SK-HEP-1 cells in MTT assay; D: Cell cycle distribution detected by DNA ploidy analysis; E): Percentages of SK-HEP-1 cells in the G0/G1, S and G2/M phases; F: Migration; G: Metastasis in a Transwell chamber invasion assay. Data are mean ± SD (n = 3). aP < 0.05, bP < 0.01 vs NC and CON.
- Citation: Qiu FN, Huang Y, Chen DY, Li F, Wu YA, Wu WB, Huang XL. Eukaryotic elongation factor-1α 2 knockdown inhibits hepatocarcinogenesis by suppressing PI3K/Akt/NF-κB signaling. World J Gastroenterol 2016; 22(16): 4226-4237
- URL: https://www.wjgnet.com/1007-9327/full/v22/i16/4226.htm
- DOI: https://dx.doi.org/10.3748/wjg.v22.i16.4226


