Copyright
©The Author(s) 2016.
World J Gastroenterol. Apr 28, 2016; 22(16): 4120-4135
Published online Apr 28, 2016. doi: 10.3748/wjg.v22.i16.4120
Published online Apr 28, 2016. doi: 10.3748/wjg.v22.i16.4120
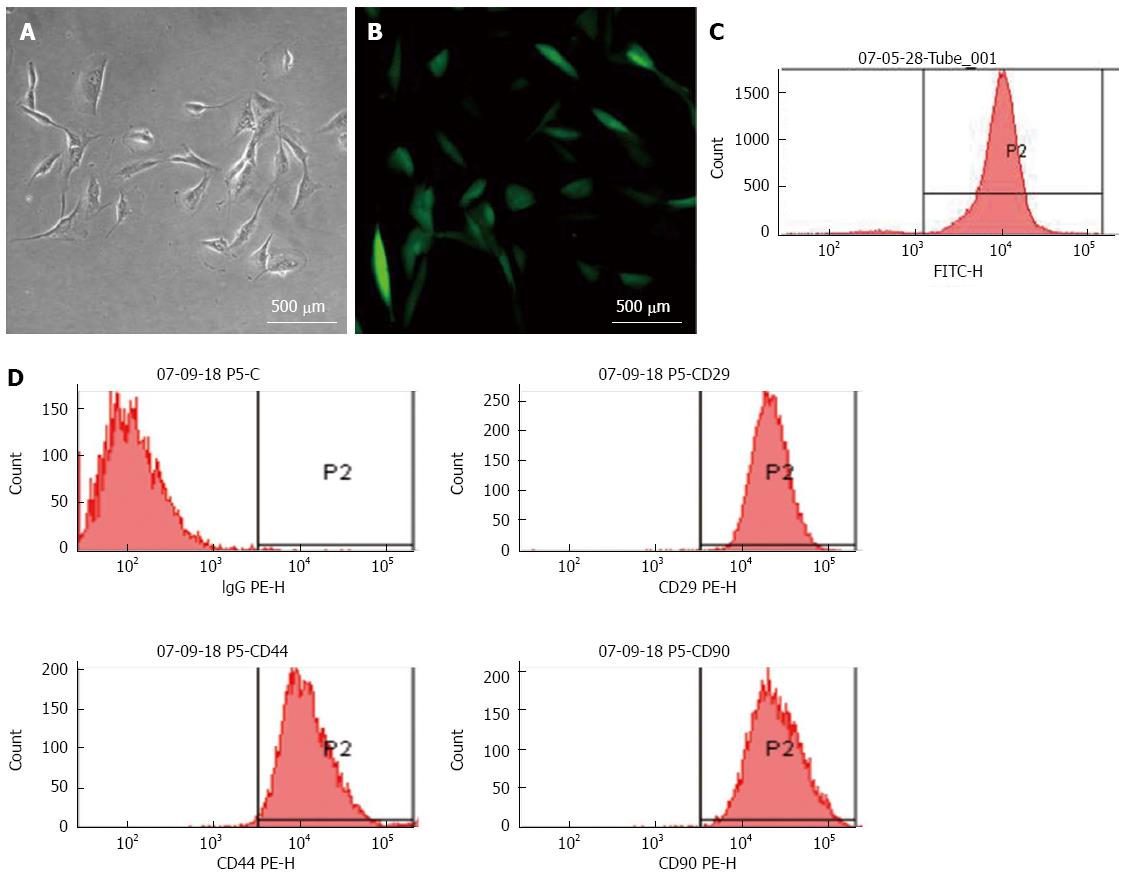
Figure 1 Characterization of mesenchymal stem cells (MSCs).
MSCs transfected with a lentiviral vector encoding green fluorescent protein (GFP) were cultured for 3 d in vitro and observed by A: Light and B: Fluorescent microscopy (magnification × 200, scale bar = 500 μm); C: Flow cytometry of MSCs revealed > 97% expressed GFP after propagation; D: Surface markers of the cultured MSCs were identified by flow cytometry: > 90% of GFP-MSCs were positive for CD29 (upper right), CD44 (lower left) and CD90 (lower right); isotypic antibodies served as the control (upper left).
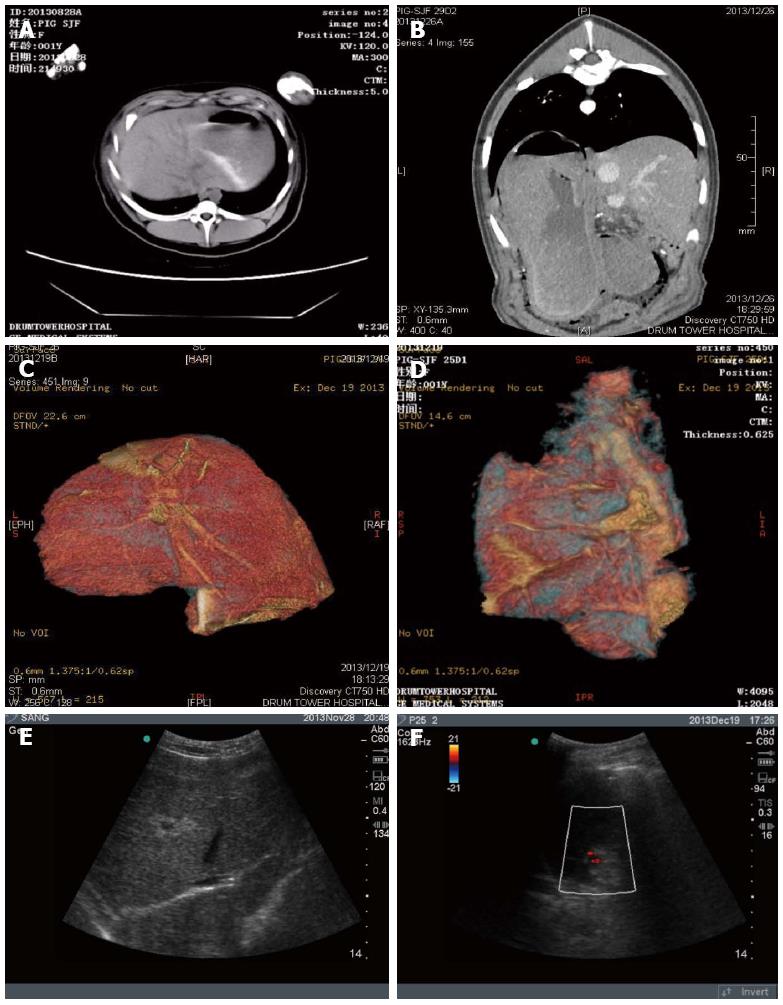
Figure 2 Imaging evaluation of residual liver volume after hepatectomy.
A and B: CT examination; C and D: CT reconstruction analysis indicated that an average 85% of liver was resected; E and F: B-scan ultrasound was performed to examine ascites (A, C, E: Sham-operated swine; B, D, F: Hepatectomized swine).
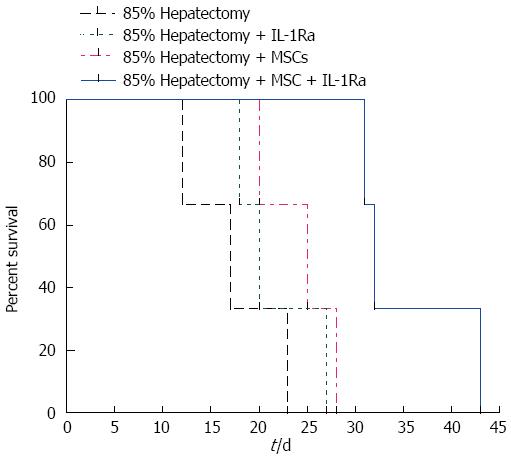
Figure 3 Survival rate after partial (85%) liver hepatectomy.
IL-1Ra: Interleukin-1 receptor antagonist; MSC: Mesenchymal stem cell transplantation.
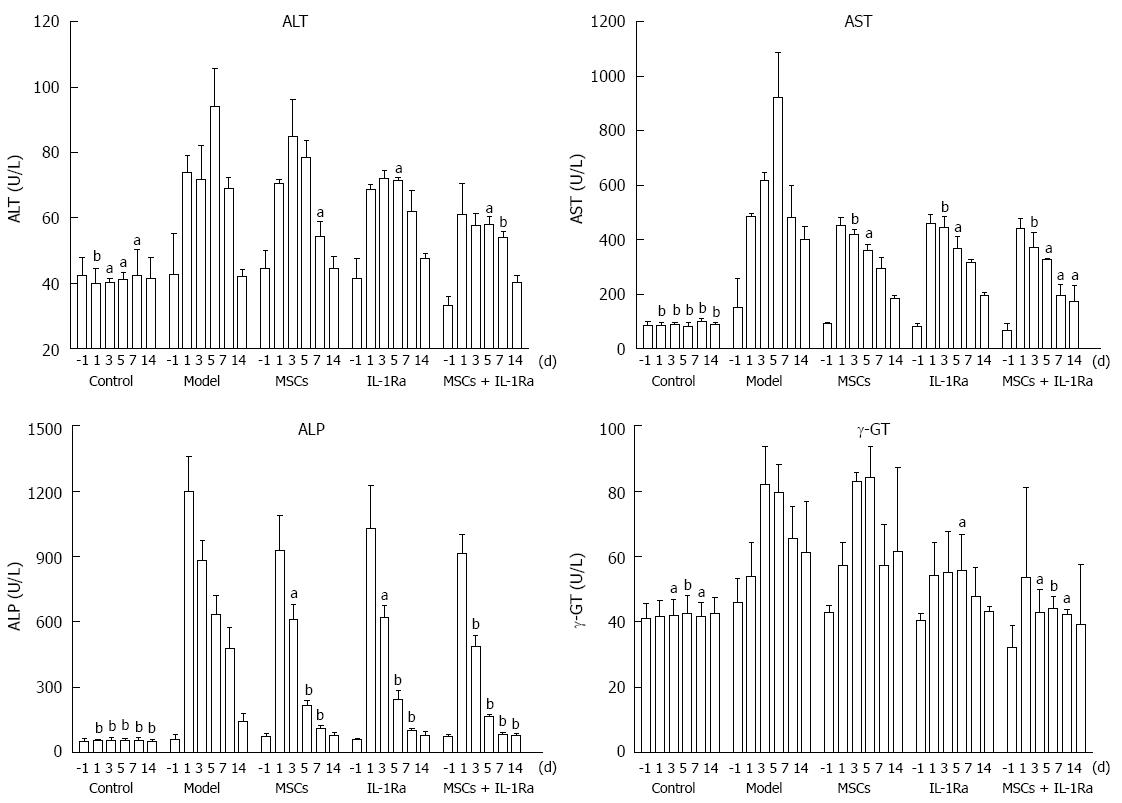
Figure 4 Serologic analyses.
Serum samples collected at various times before (-1 d) and after (1 d, 3, d, 5 d, 7 d, and 14 d) surgery were analyzed for levels of alanine aminotransferase (ALT), aspartate transaminase (AST), alkaline phosphatase (ALP), and γ-glutamyl transpeptidase (γ-GT); aP < 0.05, bP < 0.01 compared with model group. IL-1Ra: Interleukin-1 receptor antagonist; MSC: Mesenchymal stem cell transplantation.
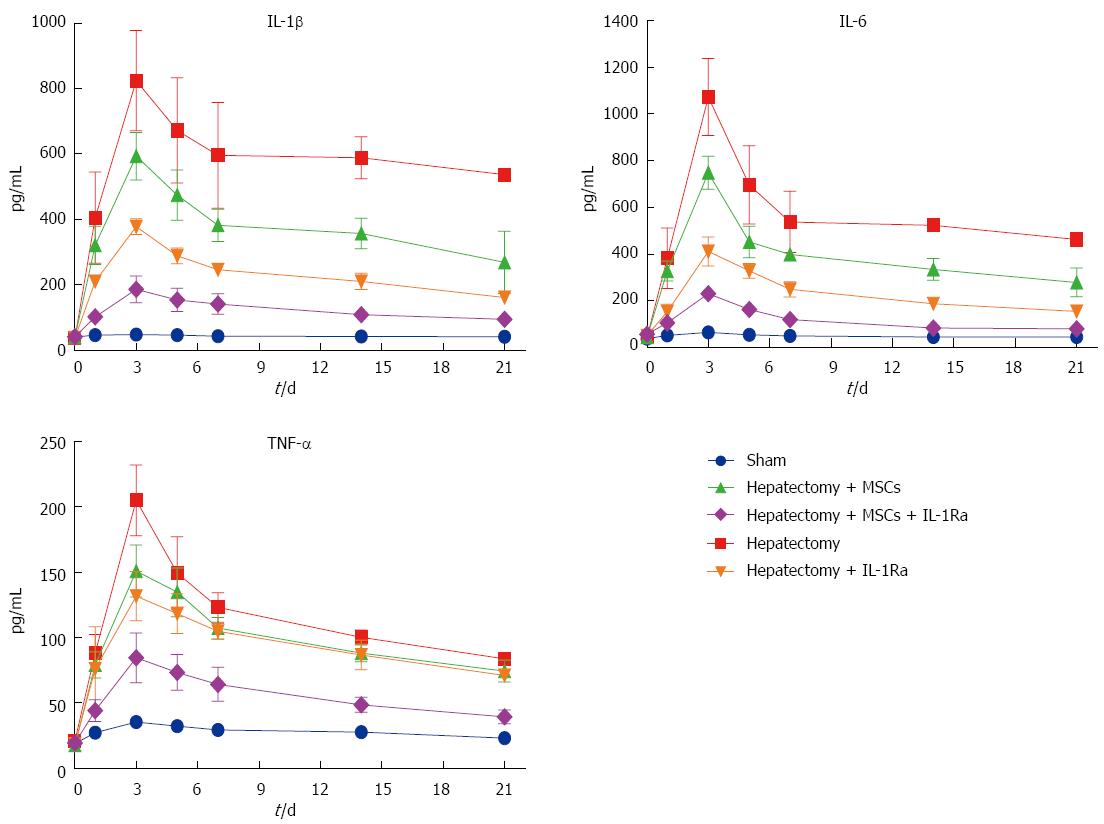
Figure 5 Serum levels of inflammatory cytokines.
Serum samples collected at various times (0 d, 1 d, 3, d, 5 d, 7 d, 14 d, and 21 d) after surgery were analyzed for levels of IL-1β, IL-6, and TNF-α by ELISA. IL: Interleukin; IL-1Ra: IL-1 receptor antagonist; MSC: Mesenchymal stem cell transplantation; TNF: Tumor necrosis factor.
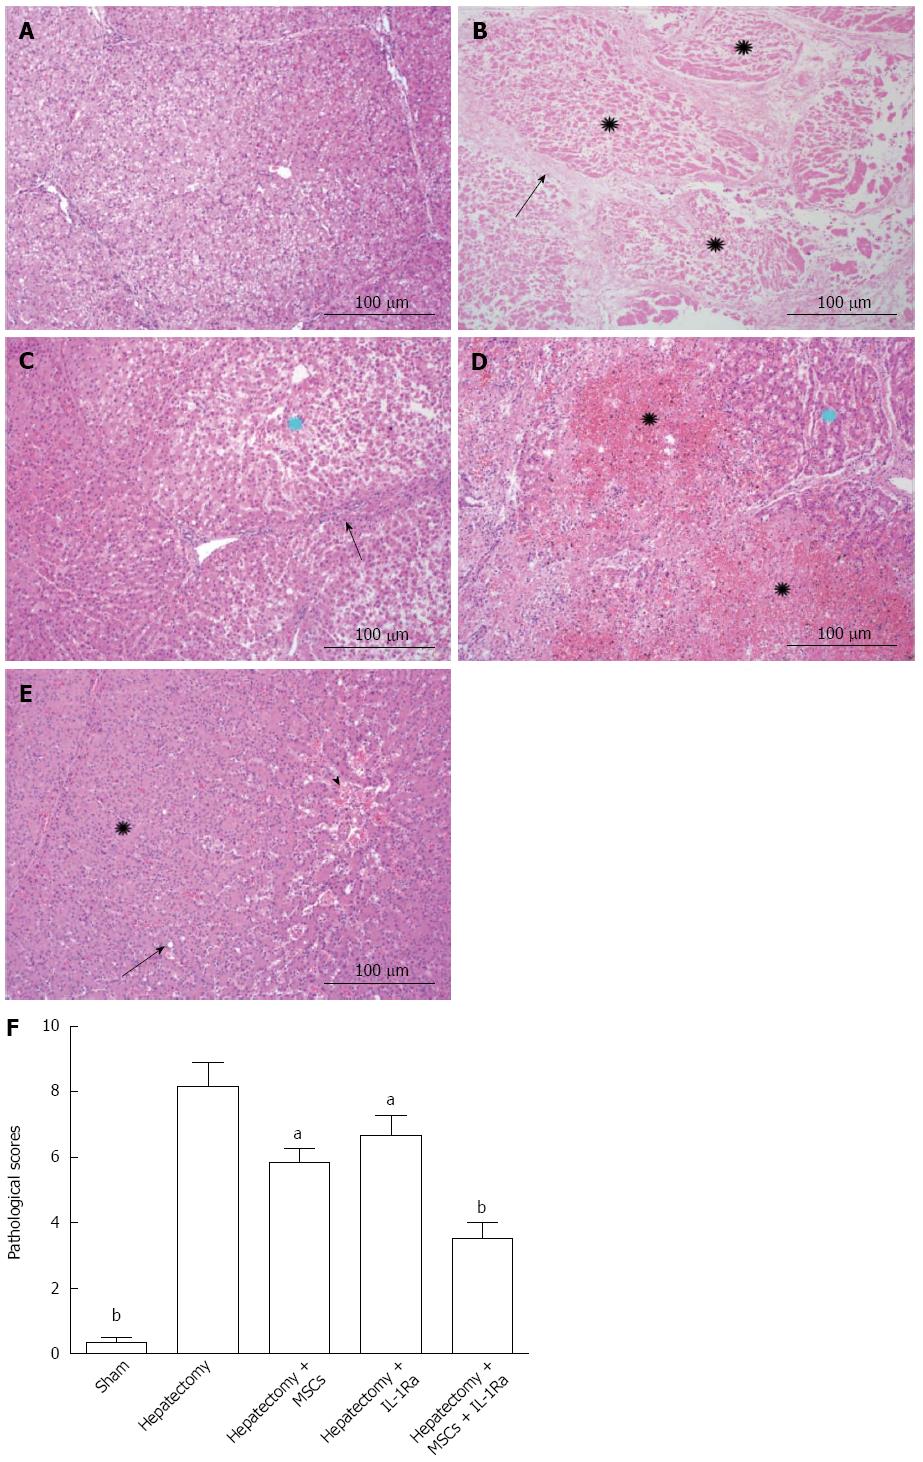
Figure 6 Histologic analysis of liver tissues.
Hematoxylin and eosin staining of liver sections taken seven days post-hepatectomy in A: Normal, sham-operated control; B: After hepatectomy (black stars indicate complete necrosis in liver organization; black arrow represents interlobular fiber structure); C: With MSC transplantation (blue star shows a hepatic lobule near the central part and necrosis of hepatocytes; black arrow shows the fibrous tissue and some inflammatory cell infiltration); D: Treatment with IL-1Ra (black stars show hemorrhage and necrosis in the hepatic lobe; blue star represents the liver cells in the hemorrhagic area); E: Combined MSC transplantation and IL-1Ra treatment (black star shows a normal hepatic lobule; black arrows indicate fatty degeneration of hepatocytes and hepatic sinus dilation with hyperemia in central hepatic lobe) (magnification × 100, scale bar = 100 μm); F: Histopathologic scores of liver tissues after hepatectomy. aP < 0.05 vs hepatectomy + MSCs + IL-1Ra; bP < 0.01 vs hepatectomy. IL-1Ra: Interleukin-1 receptor antagonist; MSC: Mesenchymal stem cell transplantation.
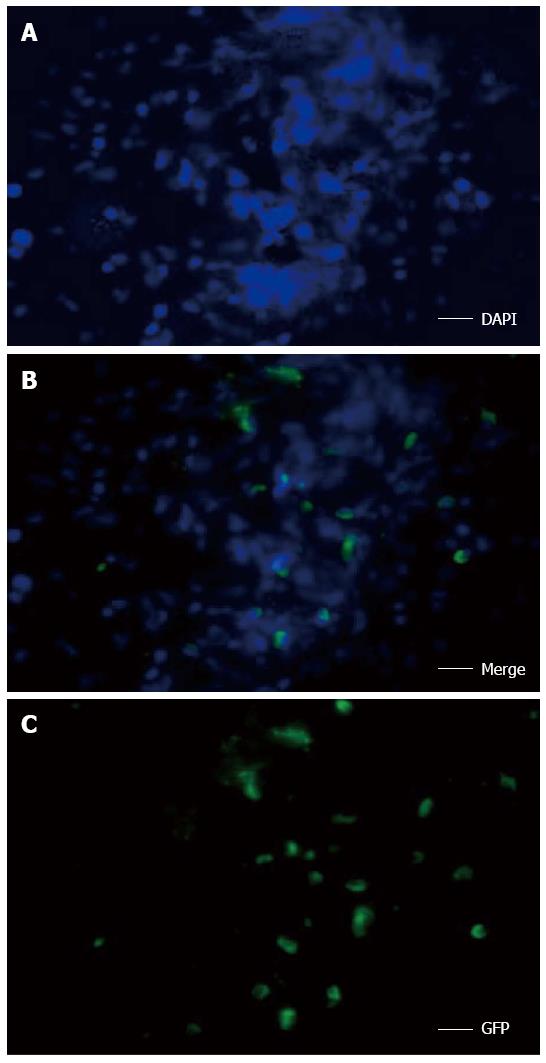
Figure 7 Fluorescence microscopy of green fluorescent protein (GFP)-expressing mesenchymal stem cells.
Transplanted cells in the combined therapy group were distributed around the hepatic lobule (nuclei are stained blue with DAPI; scale bar = 20 μm).
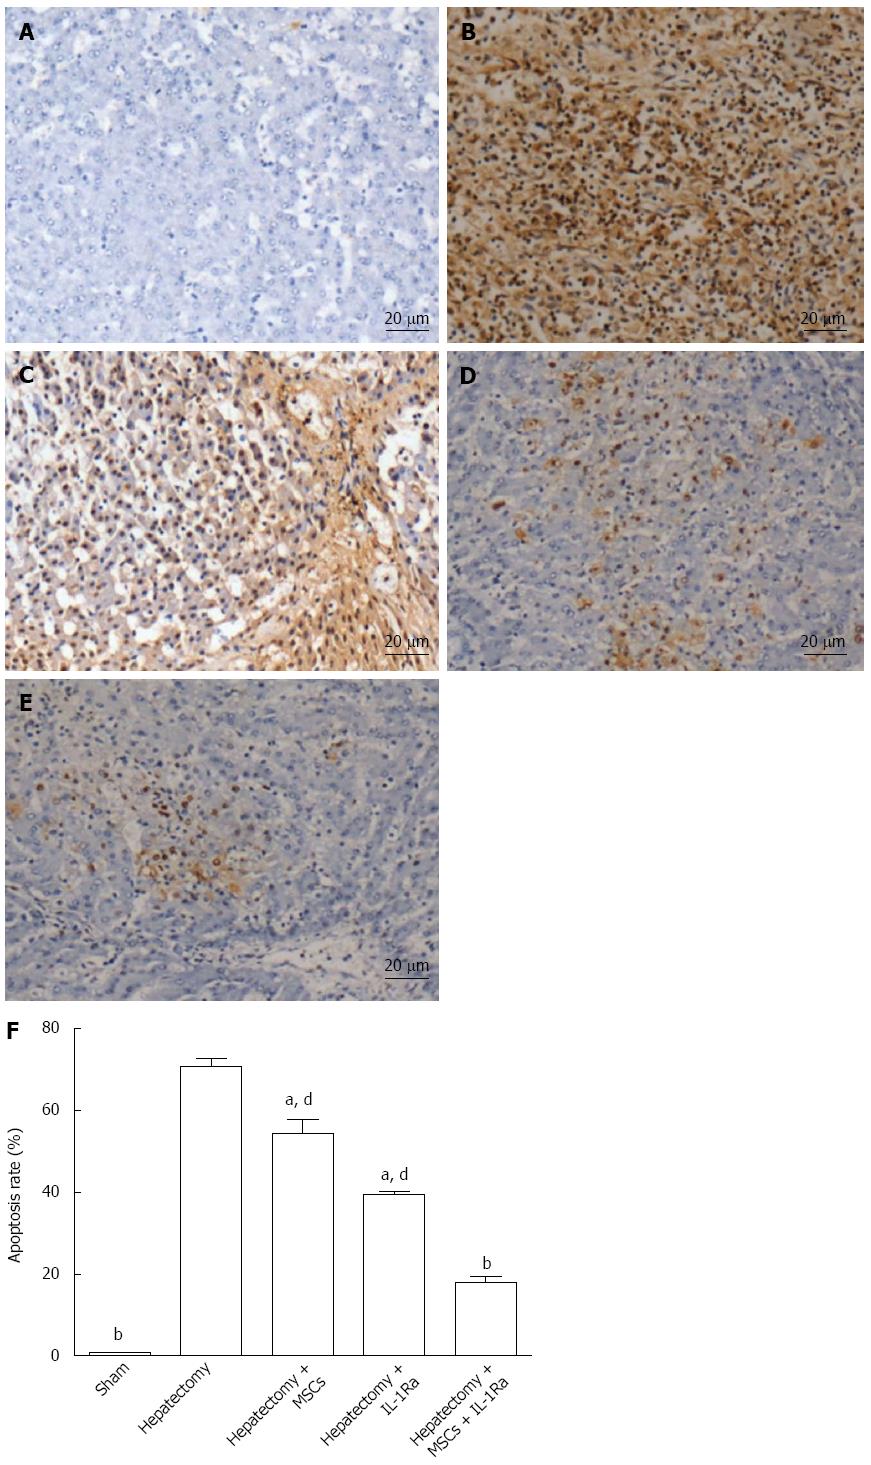
Figure 8 Assessment of apoptosis seven days after hepatectomy.
Apoptotic cells were visualized by TUNEL staining in A: Normal, sham-operated control; B: After hepatectomy; C: With MSC transplantation; D: Treatment with IL-1Ra; and E: Combined MSC transplantation and IL-1Ra (magnification × 100; scale bar = 20 μm); F: Percentage of TUNEL-positive cells relative to the total cell count was used to estimate the apoptosis rate. aP < 0.05, bP < 0.01 vs hepatectomy model group; dP < 0.01 vs hepatectomy + MSCs + IL-1Ra combination therapy group. IL-1Ra: Interleukin-1 receptor antagonist; MSC: Mesenchymal stem cell transplantation; TUNEL: Terminal deoxynucleotidyl transferase dUTP nick end labeling.
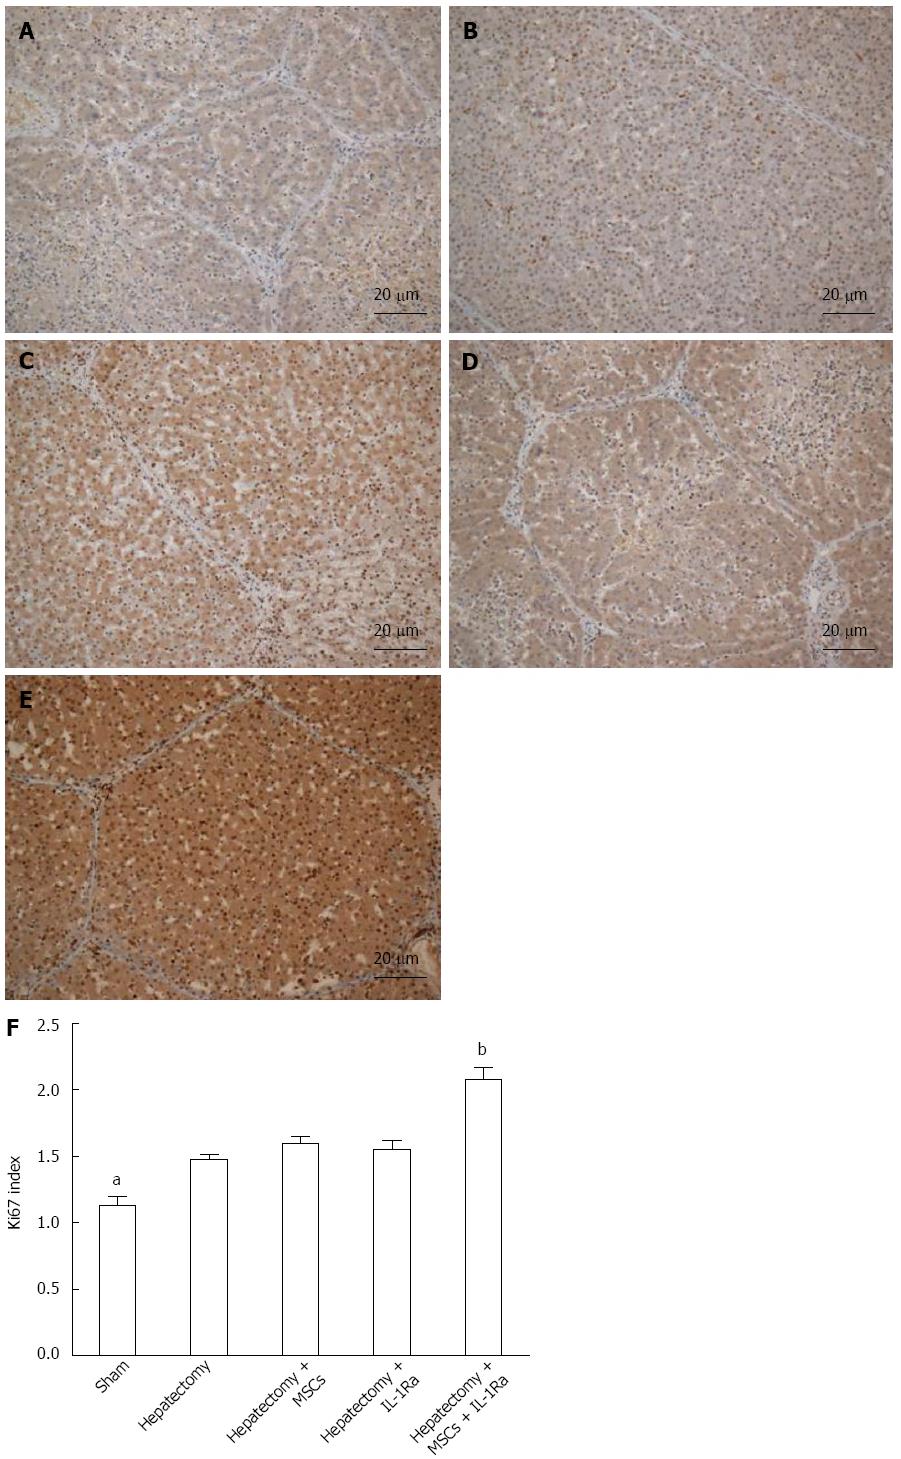
Figure 9 Hepatic cell proliferation.
Expression of Ki67 protein was determined by immunohistochemistry in A: Normal, sham-operated control; B: After hepatectomy; C: With MSC transplantation; D: Treatment with IL-1Ra; and E: Combined MSC transplantation and IL-1Ra (magnification × 100; scale bar = 20 μm); F: Percentage of Ki67-stained hepatocytes per total number of hepatocytes was used as calculate the Ki67 index. aP < 0.05, bP < 0.01 vs hepatectomy. IL-1Ra: Interleukin-1 receptor antagonist; MSC: Mesenchymal stem cell transplantation.
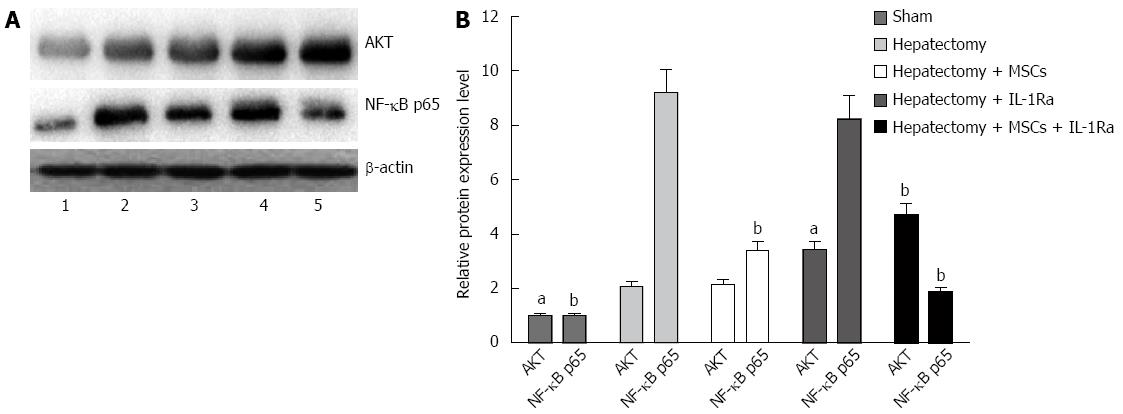
Figure 10 Western blot analysis for expression of Akt and NF-κB after acute liver injury.
A: Representative Western blot showing Akt, NF-κB, and β-actin (lane 1, normal control; lane 2, hepatectomy; lane 3, with IL-1Ra treatment; lane 4, with MSC transplantation; lane 5, with MSC transplantation and IL-1Ra treatment. B: Band densitometry was expressed as fold change relative to the internal control (n = 6). aP < 0.05, bP < 0.01 vs hepatectomy. Akt: Protein kinase B; IL-1Ra: Interleukin-1 receptor antagonist; MSC: Mesenchymal stem cell transplantation; NF-κB: Nuclear factor κB.
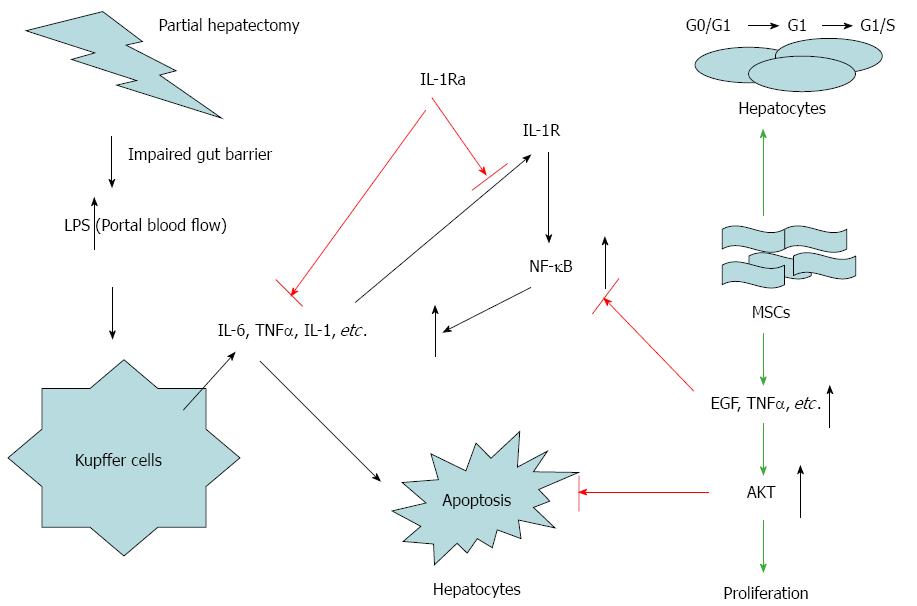
Figure 11 Schematic illustrating the proposed dual mechanism of action of combination therapy.
(1) Inhibition of NF-κB leads to decreased IL-1, IL-6, and TNF-α expression, which appears to be the central mechanism by which IL-1Ra combines with MSC transplantation to promote regeneration of liver cells. (2) Upregulation of Akt expression due to EGF and TGF-α growth factors induces hepatocyte survival, DNA synthesis, and cell division. Cytokines, including IL-1, IL-6, and TNF-α, are secreted by nonparenchymal cells, such as Kupffer cells and sinusoidal epithelial cells, following hepatectomy. Exogenous IL-1Ra blocks IL-1R, reducing proinflammatory mediators, and enhancing MSC transplantation efficiency. This benefits initial priming of hepatocytes, with the transition of quiescent hepatocytes from the G0 to G1 stage of the cell cycle. Effective MSC transplantation may induce upregulation of growth factors such as hepatocyte growth factor, EGF and TGF-α, which promote Akt signaling pathways, producing an antiapoptotic effect and benefiting liver regeneration. Akt: Protein kinase B; EGF: Epidermal growth factor; IL: Interleukin; IL-1Ra: IL-1 receptor antagonist; MSC: Mesenchymal stem cell transplantation; NF-κB: Nuclear factor κB; TGF: Transforming growth factor; TNF: Tumor necrosis factor.
- Citation: Sang JF, Shi XL, Han B, Huang X, Huang T, Ren HZ, Ding YT. Combined mesenchymal stem cell transplantation and interleukin-1 receptor antagonism after partial hepatectomy. World J Gastroenterol 2016; 22(16): 4120-4135
- URL: https://www.wjgnet.com/1007-9327/full/v22/i16/4120.htm
- DOI: https://dx.doi.org/10.3748/wjg.v22.i16.4120


