Copyright
©The Author(s) 2016.
World J Gastroenterol. Apr 28, 2016; 22(16): 4109-4119
Published online Apr 28, 2016. doi: 10.3748/wjg.v22.i16.4109
Published online Apr 28, 2016. doi: 10.3748/wjg.v22.i16.4109
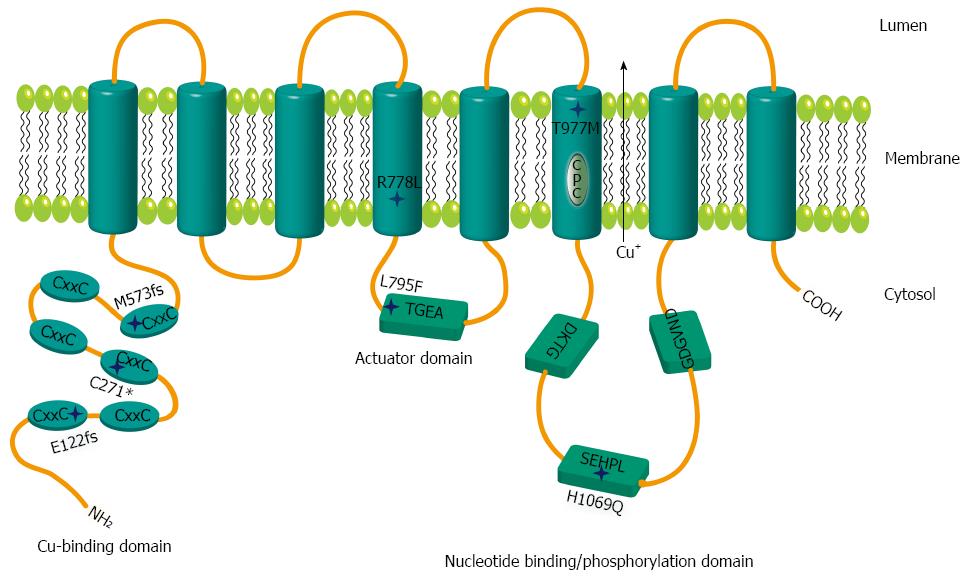
Figure 1 Schematic representation of mutations within ATP7B.
Relative positions of the mutations are shown by stars. The six metal binding domains at the N terminal are indicated by CxxC. Sequence motifs TGEA, DKTG, SEHPL, GDGVND, and CPC depict conserved elements of copper (Cu) ATPases.
Figure 2 ATP7B mRNA and protein expression in mutant cell lines.
A: Relative ATP7B mRNA expression in mutant cell lines was determined. The expression was normalized to GAPDH housekeeping gene. Gene expression as factor fold change relative to KO cells expressing wild type was calculated; B and C: Representative Western blots showing ATP7B protein at 37 °C and 30 °C, respectively.
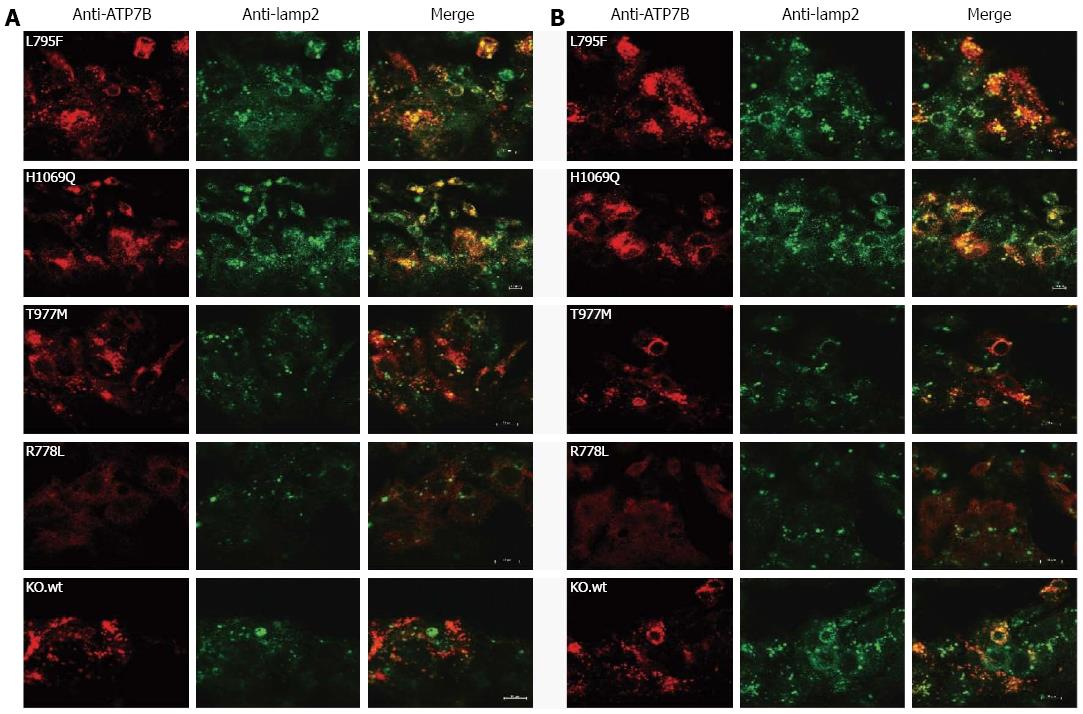
Figure 3 Localization of ATP7B mutant protein in stably transfected KO cells.
Co-localization studies were performed with lamp2 at low copper (Cu) (A) and in the presence of 100 μmol/L Cu (B). Bars represent 10 μm. A representative photograph is shown for each mutant cell line.
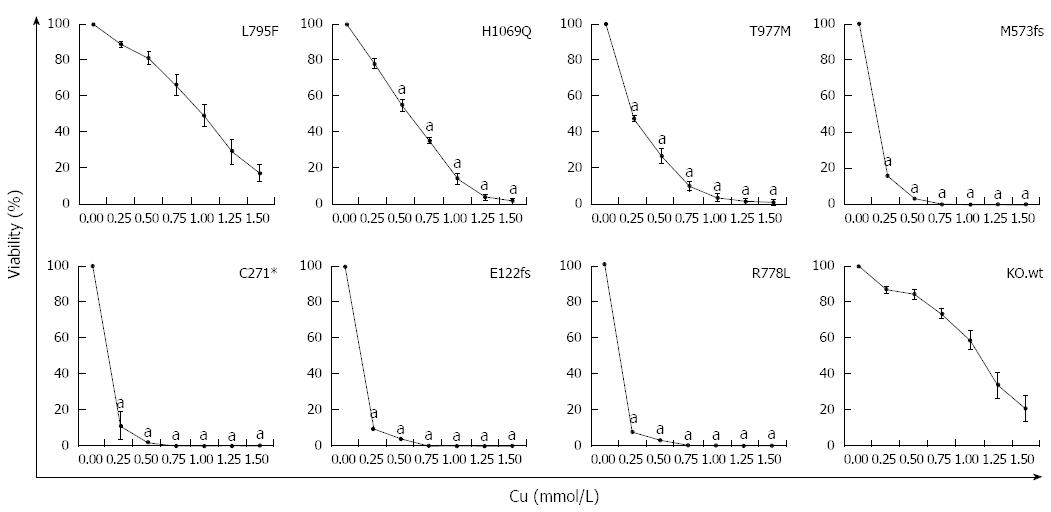
Figure 4 Survival of ATP7B mutant cell lines after copper exposure.
Cell survival of ATP7B mutant cell lines relative to control (no copper) was determined by MTT assay after 48 h copper (Cu) exposure. Data is represented as mean ± SE of at least three independent experiments. Significance (aP < 0.05) as compared to KO.wt.
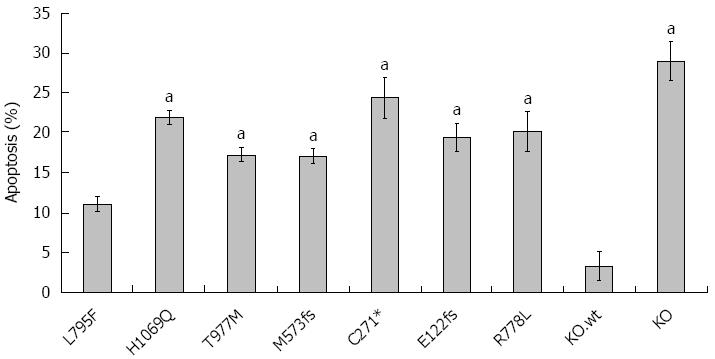
Figure 5 Rate of apoptosis in ATP7B mutant cell lines after copper exposure.
Cells were exposed to 100 μmol/L Cu for 24 h. Induction of apoptosis was determined by Annexin-V staining followed by flow cytometry analysis. Data is represented as mean ± SE of at least three independent experiments. aP < 0.05 vs KO cells expressing wild type ATP7B.
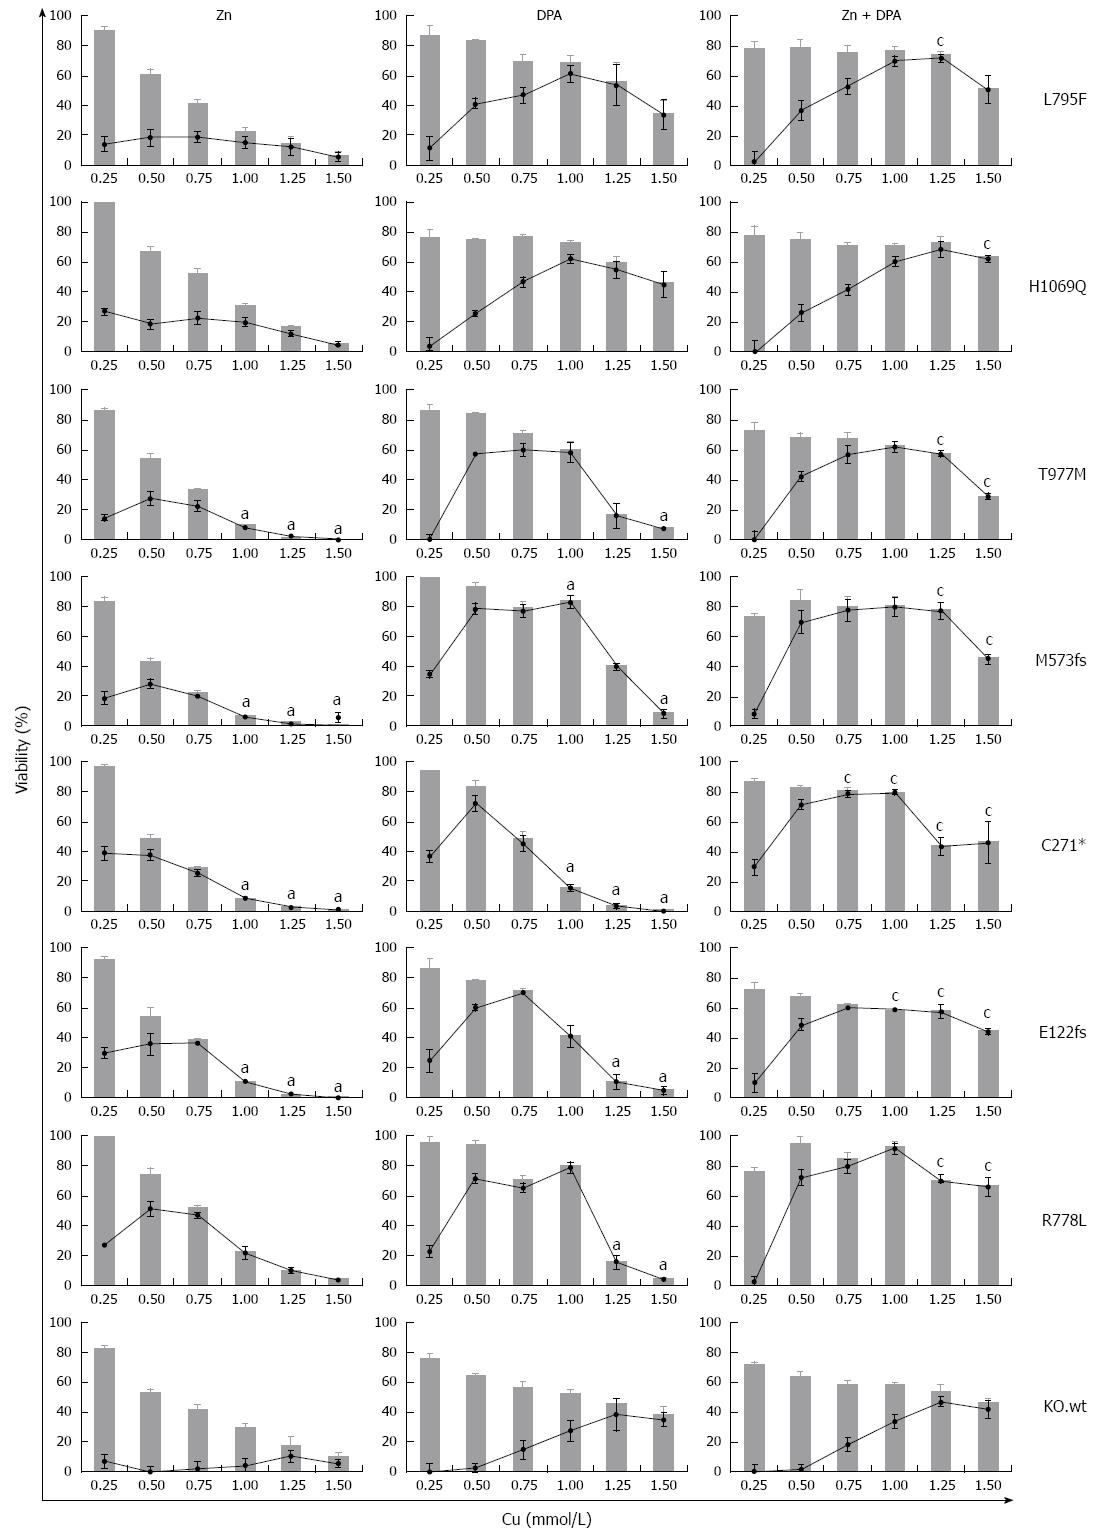
Figure 6 Survival of ATP7B mutant cell lines after zinc and D-penicillamine treatment.
Cells were treated with zinc (Zn), D-penicillamine (DPA), and Zn + DPA followed by determination of viability at 48 h. Bar graphs indicate cell viability after treatment relative to untreated cells [0 mmol/L copper (Cu)]. Relative increase of viability by individual treatment (gain) is indicated by line graph. Data is represented as mean ± SE of at least three independent experiments. Viability of KO cells expressing ATP7B wild type is shown as control. aP < 0.05 vs KO.wt cells, cP < 0.05 vs DPA treatment.
- Citation: Chandhok G, Horvath J, Aggarwal A, Bhatt M, Zibert A, Schmidt HH. Functional analysis and drug response to zinc and D-penicillamine in stable ATP7B mutant hepatic cell lines. World J Gastroenterol 2016; 22(16): 4109-4119
- URL: https://www.wjgnet.com/1007-9327/full/v22/i16/4109.htm
- DOI: https://dx.doi.org/10.3748/wjg.v22.i16.4109


