Copyright
©The Author(s) 2016.
World J Gastroenterol. Apr 7, 2016; 22(13): 3652-3662
Published online Apr 7, 2016. doi: 10.3748/wjg.v22.i13.3652
Published online Apr 7, 2016. doi: 10.3748/wjg.v22.i13.3652
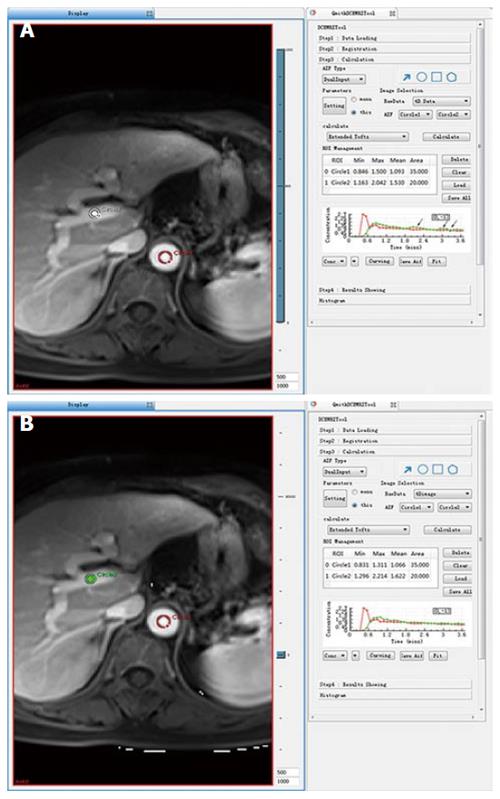
Figure 1 Concentration-time curve of the portal vein was an inferior fit (arrow) compared to that of the abdominal aorta without non-rigid registration (A); however, the concentration-time curve of the portal vein was a better fit after non-rigid registration (B).
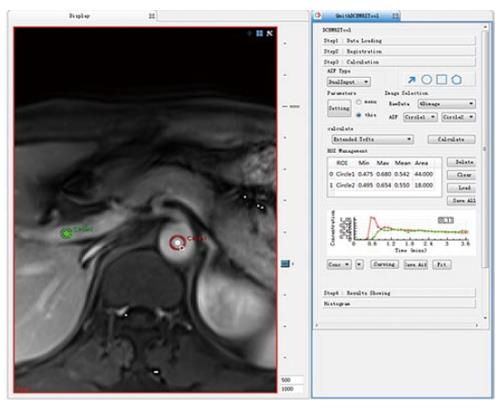
Figure 2 ROI 1 was placed on the abdominal aorta near the entrance of the celiac trunk, replacing the hepatic artery, and ROI 2 was placed on the portal vein as a dual input model to fit the vascular input function; the concentration-time curve maps of the ROI 1 and ROI 2 are shown to the right.
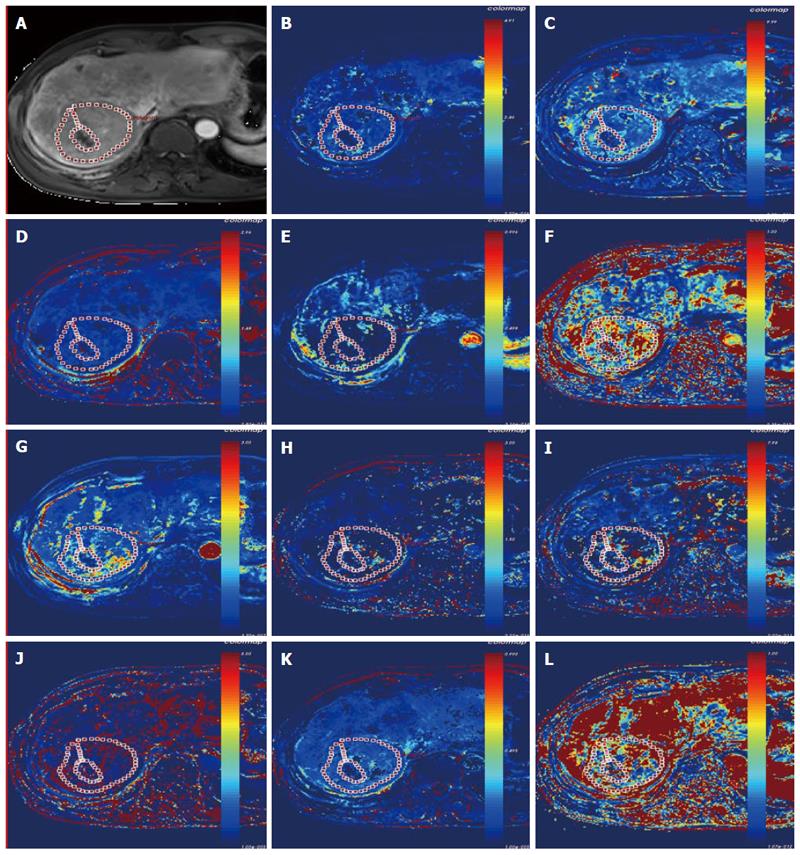
Figure 3 Lesion of the hepatocellular carcinoma in a 68-year-old man on dynamic contrast-enhanced T1WI (A); pharmacokinetic parameter map (Ktrans, kep, ve, vp, and hepatic perfusion index) derived from the dual-input extended Tofts model (B-F), and the pharmacokinetic parameter maps (Fp, PS, kep, ve, vp, and hepatic perfusion index) derived from the dual-input 2-compartment exchange model (G-L).
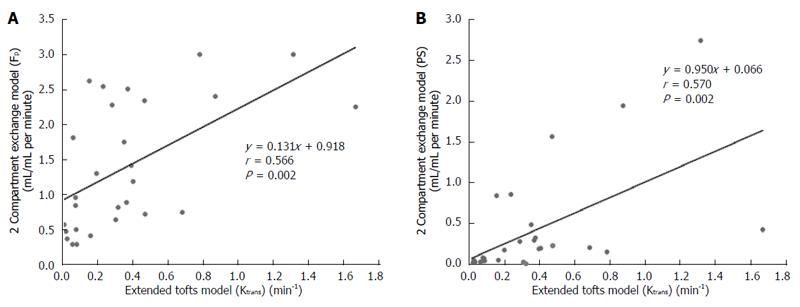
Figure 4 Scatterplots showing the correlation between Ktrans (min-1) obtained with the extended Tofts model and Fp (A) and PS (B) obtained with the 2-compartment exchange model.
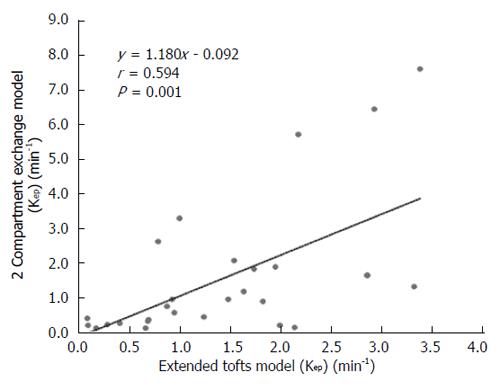
Figure 5 Scatterplot showing the significant correlation of Kep estimated with the extended Tofts model and the 2-compartment exchange model.
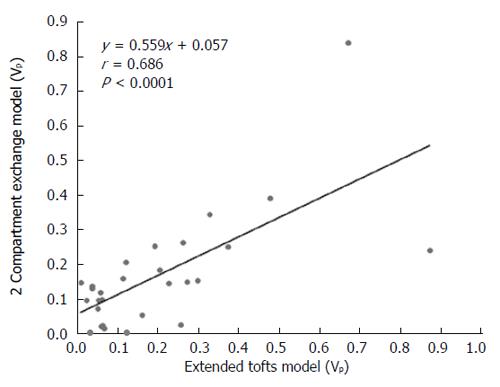
Figure 6 Scatterplot showing that vp values are correlated between the extended Tofts model and the 2-compartment exchange model.
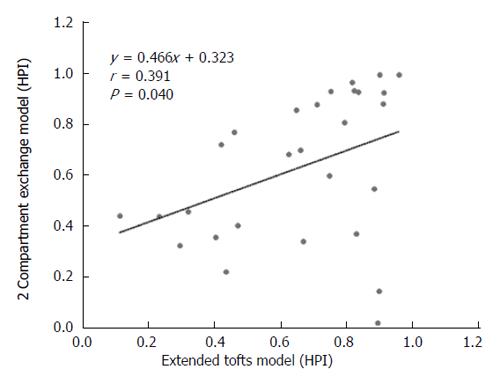
Figure 7 Scatterplot showing the correlation of hepatic perfusion index estimated with the extended Tofts model and the 2-compartment exchange model.
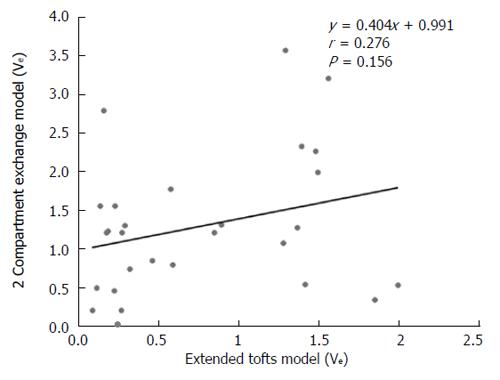
Figure 8 Scatterplot showing that ve is not correlated in the extended Tofts model and the 2-compartment exchange model.
- Citation: Yang JF, Zhao ZH, Zhang Y, Zhao L, Yang LM, Zhang MM, Wang BY, Wang T, Lu BC. Dual-input two-compartment pharmacokinetic model of dynamic contrast-enhanced magnetic resonance imaging in hepatocellular carcinoma. World J Gastroenterol 2016; 22(13): 3652-3662
- URL: https://www.wjgnet.com/1007-9327/full/v22/i13/3652.htm
- DOI: https://dx.doi.org/10.3748/wjg.v22.i13.3652


