Copyright
©The Author(s) 2016.
World J Gastroenterol. Mar 21, 2016; 22(11): 3202-3211
Published online Mar 21, 2016. doi: 10.3748/wjg.v22.i11.3202
Published online Mar 21, 2016. doi: 10.3748/wjg.v22.i11.3202
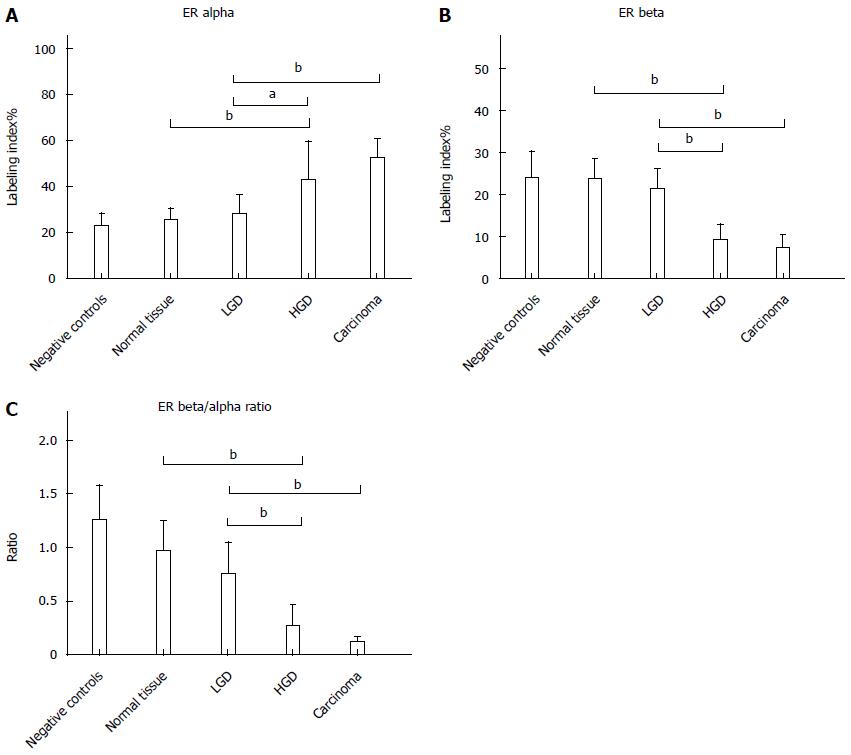
Figure 1 Labeling Index values of immunohistochemical analysis of ER alpha (A), ER beta (B) and ER beta/alpha ratio (C).
aP < 0.05; bP < 0.001.
Figure 2 Immunohistochemical staining of ER-α.
A: normal; B: HGD; C: AC.
Figure 3 Immunohistochemical staining of ER-β.
A: Normal; B: HGD; C: AC.
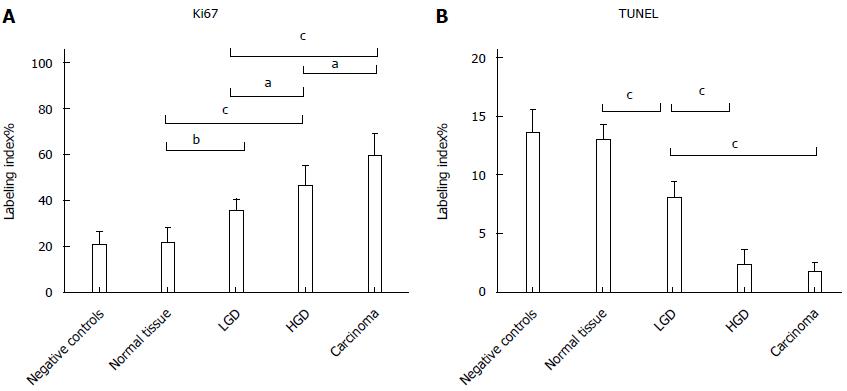
Figure 4 Labeling Index values of immunohistochemical analysis for proliferation - Ki67 (A) and apoptosis - TUNEL (B).
aP < 0.05; bP < 0.01; cP < 0.001.
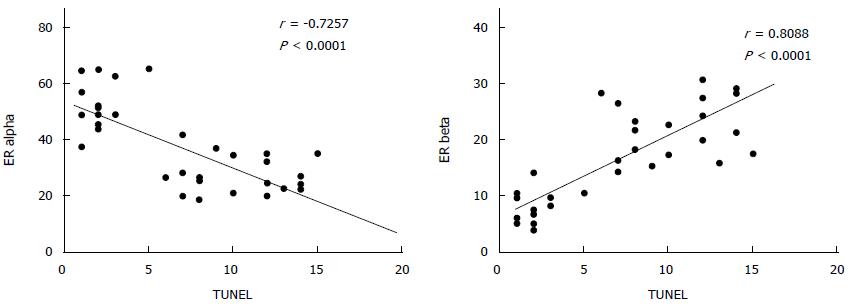
Figure 5 Direct correlation between ER-beta and TUNEL and inverse correlation between ER-α and TUNEL (Pearson’s test).
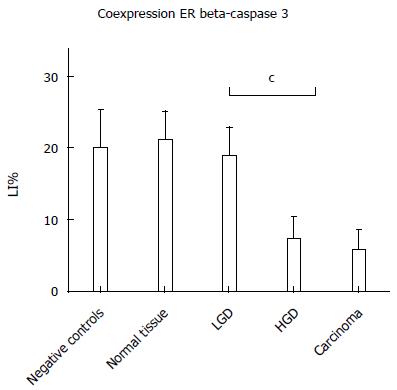
Figure 6 Labeling Index values of confocal microscopy analysis of ER-beta and caspase 3 co-expression.
cP < 0.001.
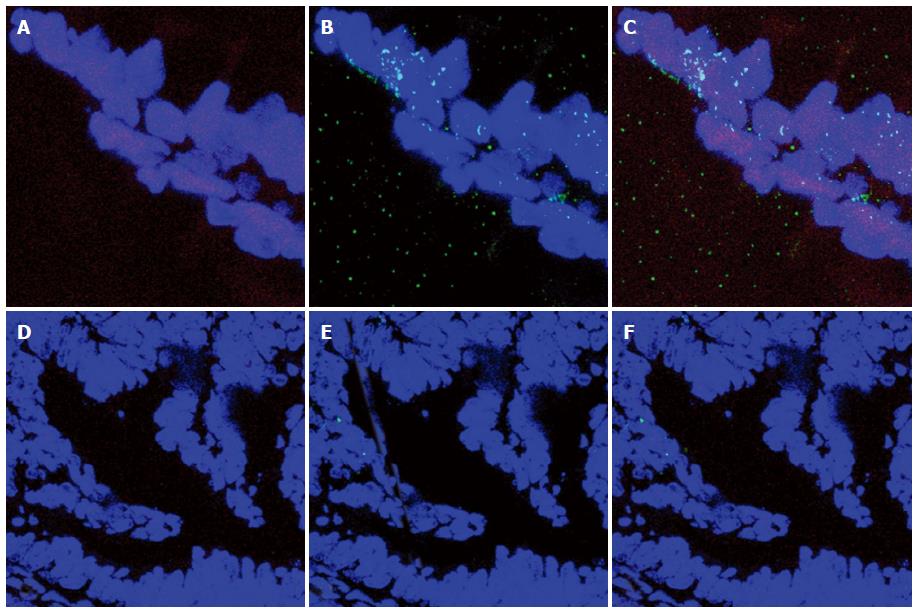
Figure 7 Co-expression of ER-β and caspase 3 is clearly shown in normal tissue.
A: Nuclear ER-β expression in a normal villous area (red signal); B: Nuclear caspase 3 expression in a normal villous area (green signal); C: Merge of the two signals and counterstaining with TOPRO 3 (blue signal): magnification at × 1000; D: Nuclear ER-beta expression in the HGD area (red signal); E: Nuclear caspase 3 expression in the HGD area (green signal); F: Merge of the two signals and counterstaining with TOPRO 3 (blue signal): magnification at × 400.
- Citation: Di Leo A, Nesi G, Principi M, Piscitelli D, Girardi B, Pricci M, Losurdo G, Iannone A, Ierardi E, Tonelli F. Epithelial turnover in duodenal familial adenomatous polyposis: A possible role for estrogen receptors? World J Gastroenterol 2016; 22(11): 3202-3211
- URL: https://www.wjgnet.com/1007-9327/full/v22/i11/3202.htm
- DOI: https://dx.doi.org/10.3748/wjg.v22.i11.3202


