Copyright
©The Author(s) 2016.
World J Gastroenterol. Mar 21, 2016; 22(11): 3186-3195
Published online Mar 21, 2016. doi: 10.3748/wjg.v22.i11.3186
Published online Mar 21, 2016. doi: 10.3748/wjg.v22.i11.3186
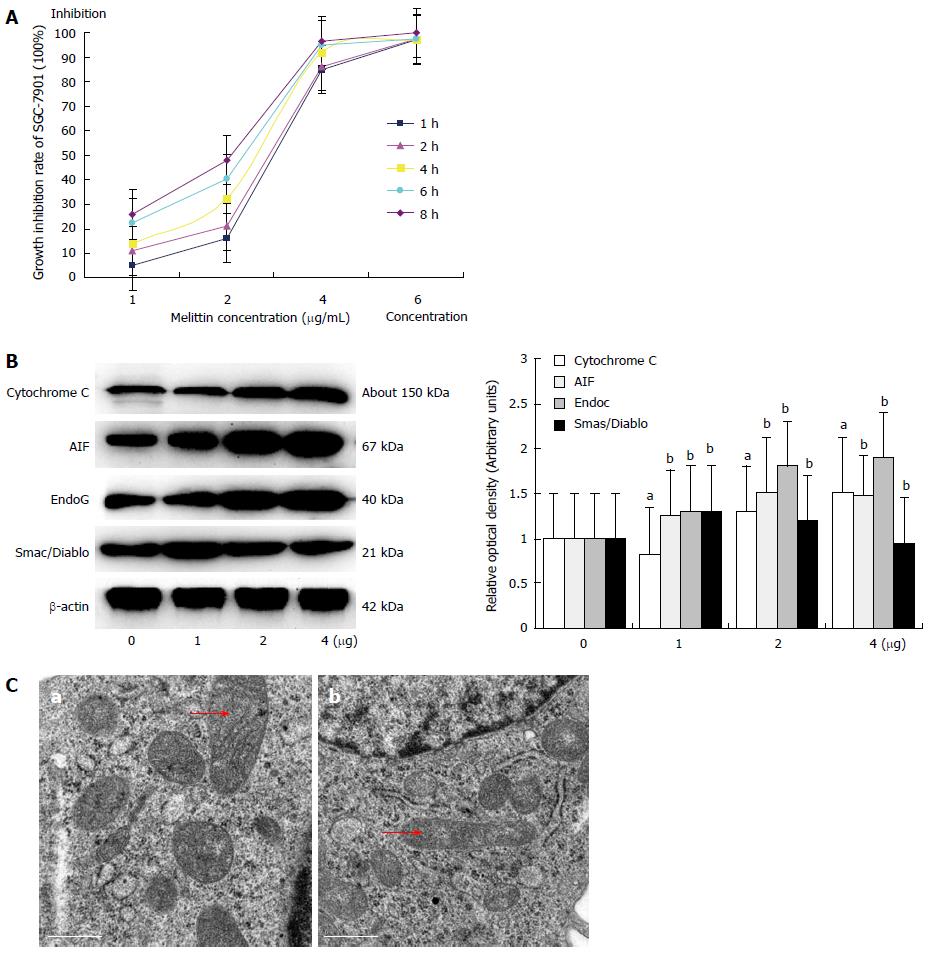
Figure 1 Melittin alters the release of mitochondria proteins in SGC-7901 cells.
A: Growth inhibition of a human gastric cancer cell line (SGC-7901) by melittin. Numbers 1-6 indicates the melittin concentration used (1-6 μg/mL) to inhibit the growth of the gastric cancer cells after 1, 2, 4, 6, or 8 h; B: The expression of Cytochrome C, apoptosis-inducing factor (AIF), endonuclease G (EndoG), second mitochondria-derived activator of caspases (Smac)/direct IAP binding protein with low isoelectric point, pI (Diablo) detected by western blot. (aP < 0.05 vs the control group; bP < 0.01 vs the control group); C: Ultra microstructure of mitochondria after incubation with 4 μg/mL melittin [a: SGC-7901 control group; b: SGC-7901 cells incubated with 4 μg/mL melittin for 4 h; (scale bar 0.5 μm, × 6600)]. The arrow is the mitochondria.
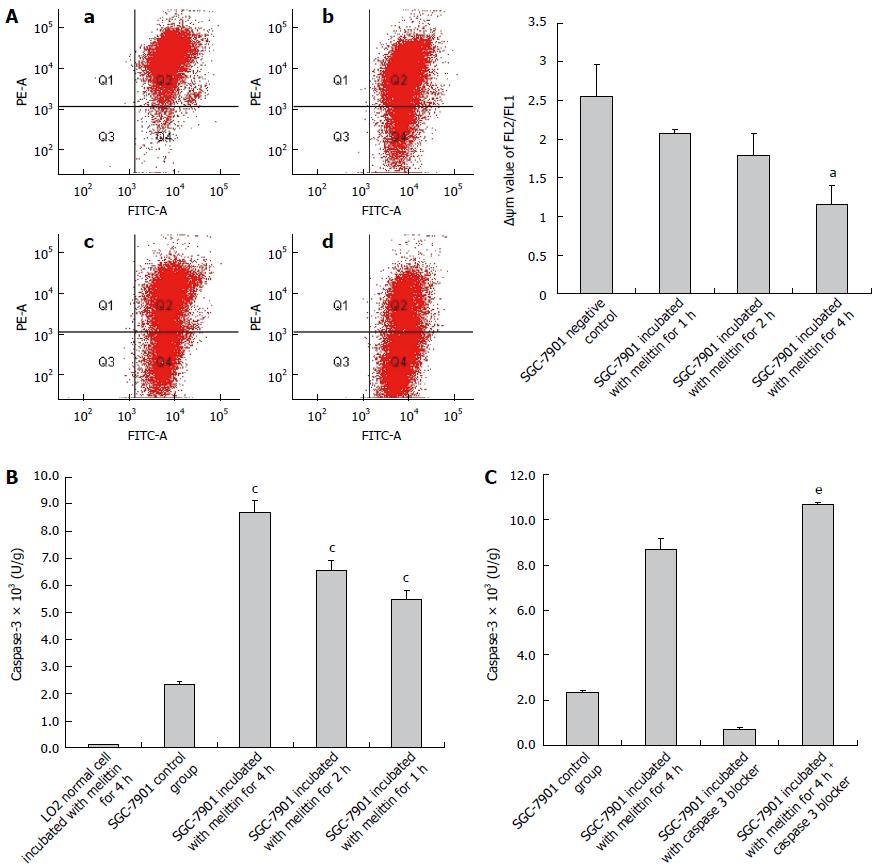
Figure 2 Melittin alters the mitochondrial membrane potential levels and caspase-3 expression of SGC-7901 cells.
A: Mitochondrial membrane potential (MMP) (Δψm) levels of SGC-7901 cells after incubation with 4 μg/mL melittin for various times. [a: SGC-7901 cells control group; b: SGC-7901 cells incubated with 4 μg/mL melittin for 1 h; c: SGC-7901 cells incubated with 4 μg/mL melittin for 2 h; d: SGC-7901 cells incubated with 4 μg/mL melittin for 4 h (aP < 0.05 vs the control group); B: The effect of melittin on the release of caspase-3. L-O2 normal cells incubated with 4 μg/mL melittin for 4 h; SGC-7901 control cell; SGC-7901 cells incubated with 4 μg/mL melittin for 4 h, 2 h, and 1 h; (cP < 0.05 vs the control group); C: The release of caspase-3 in SGC-7901 cells after the addition of a caspase-3 blocker. SGC-7901 control group; SGC-7901 cells incubated with 4 μg/mL melittin for 4 h; SGC-7901 cells with caspase 3 blocker; SGC-7901 cells incubated with 4 μg/mL melittin for 4 h added with caspase-3 blocker; (eP < 0.05 vs the control group).
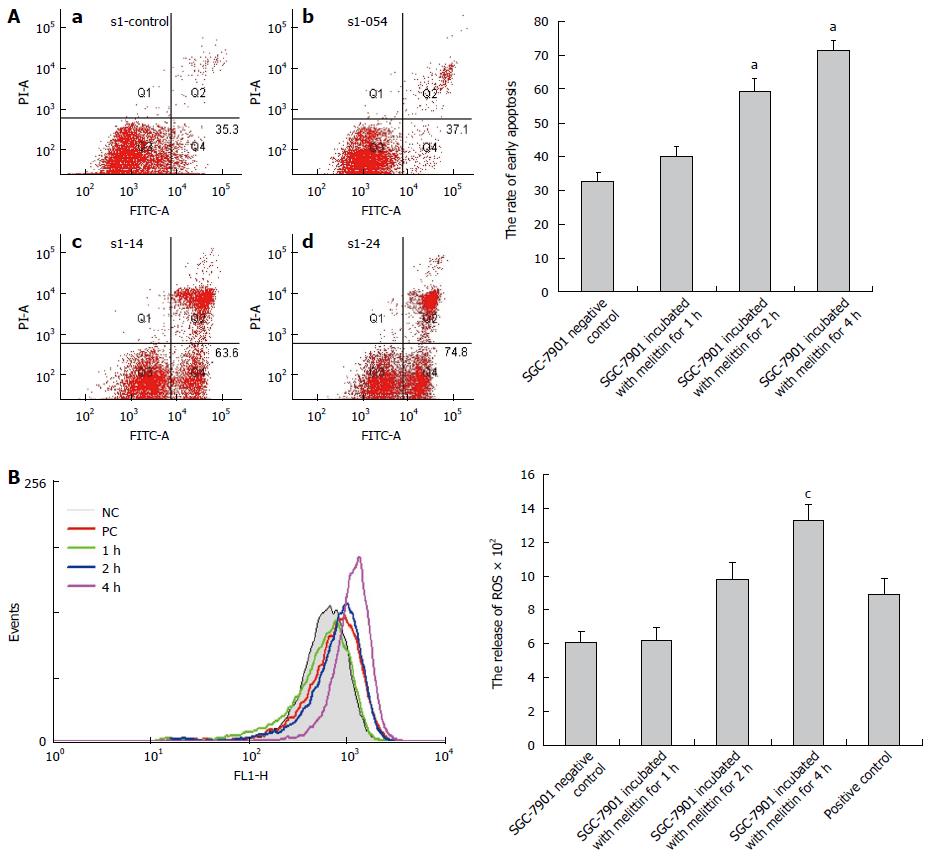
Figure 3 Melittin induced the apoptosis of SGC-7901 cells and increased the levels of reactive oxygen species.
A: Melittin (4 μg/mL) induced the early apoptosis of SGC-7901 cells at different time points [a: SGC-7901 cells negative control group b: SGC-7901 cells incubated with 4 μg/mL melittin for 1 h; c: 4 SGC-7901 cells incubated with 4 μg/mL melittin for 2 h; d: SGC-7901 cells incubated with 4 μg/mL melittin for 4 h; (aP < 0.05 vs the control group)]; B: The ROS levels in SGC-7901 cells after incubation with 4 μg/mL melittin. NC: SGC-7901 cells negative control group; PC: Positive control group; 1 h: SGC-7901 cells incubated with 4 μg/mL melittin for 1 h; 2 h: SGC-7901 cells incubated with 4 μg/mL melittin for 2 h; 4 h: SGC-7901 cells incubated with 4 μg/mL melittin for 4 h (cP < 0.05 vs the control group).
- Citation: Kong GM, Tao WH, Diao YL, Fang PH, Wang JJ, Bo P, Qian F. Melittin induces human gastric cancer cell apoptosis via activation of mitochondrial pathway. World J Gastroenterol 2016; 22(11): 3186-3195
- URL: https://www.wjgnet.com/1007-9327/full/v22/i11/3186.htm
- DOI: https://dx.doi.org/10.3748/wjg.v22.i11.3186


