Copyright
©The Author(s) 2016.
World J Gastroenterol. Jan 7, 2016; 22(1): 205-220
Published online Jan 7, 2016. doi: 10.3748/wjg.v22.i1.205
Published online Jan 7, 2016. doi: 10.3748/wjg.v22.i1.205
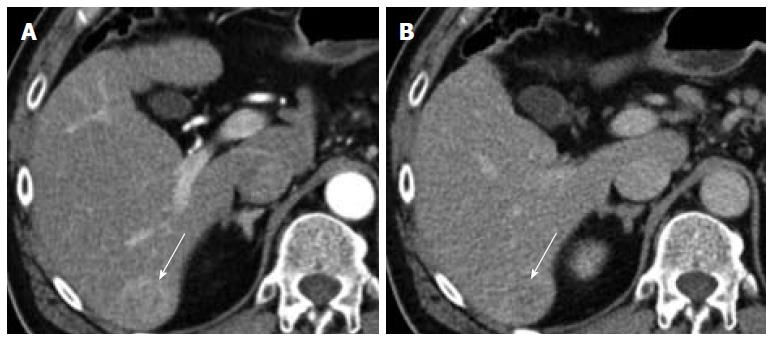
Figure 1 Typical features of arterial enhancement (A) with washout in the portal venous phase (B) is noted in segment 6 in keeping with histological-proven hepatocellular carcinoma.
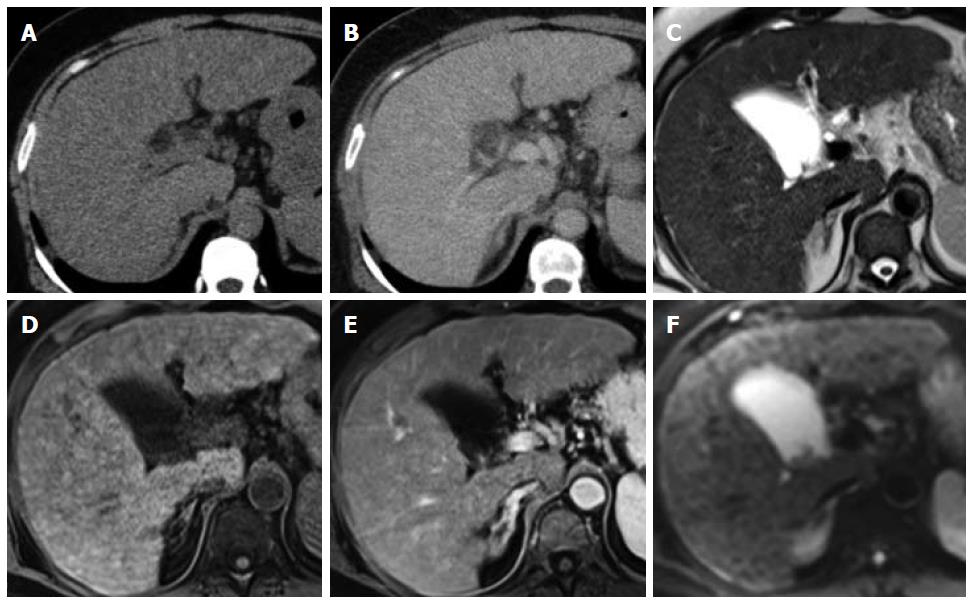
Figure 2 The liver demonstrates a nodular outline consistent with cirrhosis and multiple small regenerative nodules that are isodense on unenhanced (A) and portal venous phase (B) on computed tomography, predominantly isointense on T2W (C) and T1W (D) sequences with no evidence of arterial enhancement (E) or restricted diffusion (F).
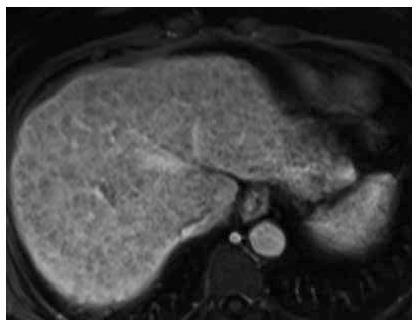
Figure 3 Multiple regenerative nodules in the portal venous phase may appear mildly hypoattenuating relative to enhancing fibrosis.
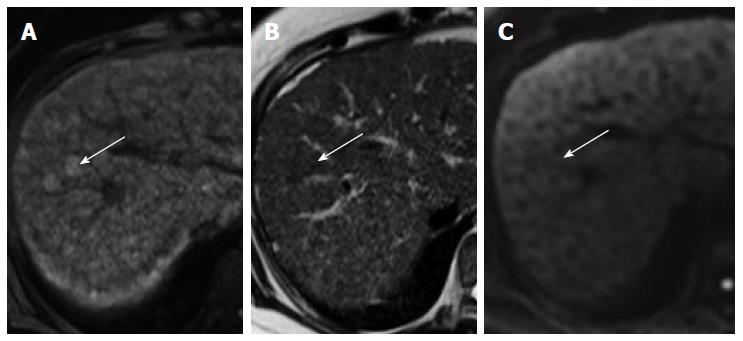
Figure 4 Dysplastic nodules may appears hyperintense on T1W (A), iso-hypointense on T2W (B) but do not show restricted diffusion (C).
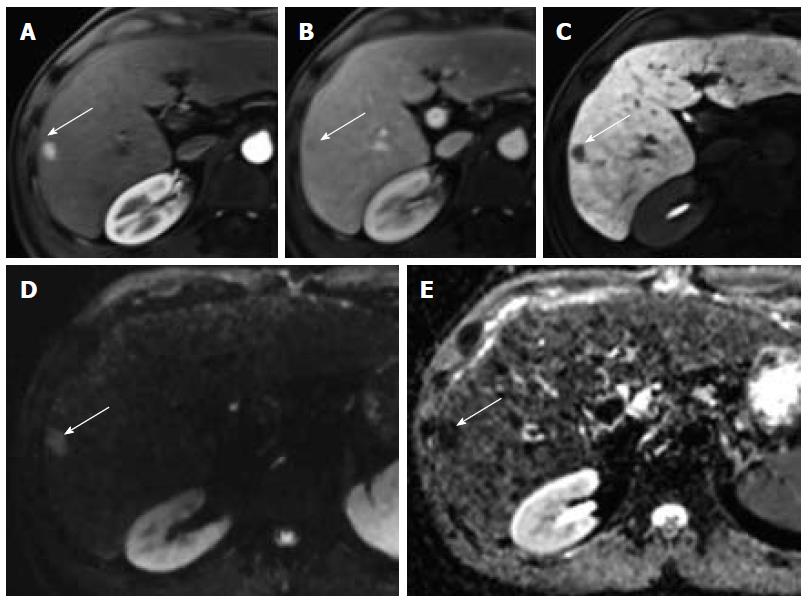
Figure 5 Typical characteristics of a hepatocellular carcinoma.
A small lesion in segment 6 demonstrates arterial enhancement (A), washout in the portal venous phase (B), hypointensity in the hepatobiliary phase (C) and restricted diffusion [hyperintense on DWI (D) and hypointense on ADC (E)].
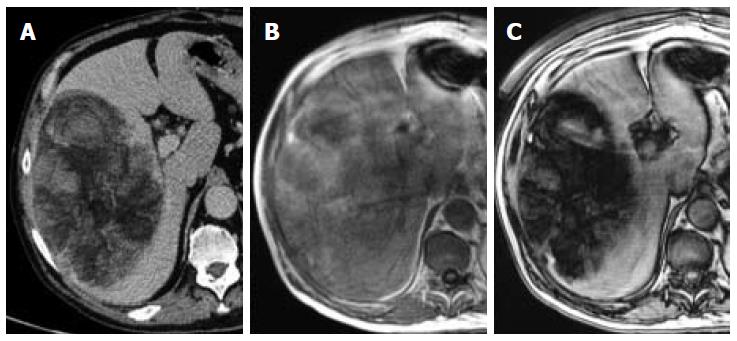
Figure 6 A large hepatocellular carcinoma in the right lobe of the liver demonstrates fat attenuation on non-contrast enhanced computed tomography (A), and loss of signal in the in- (B) and opposed-phase (C) images indicative of fat.
Figure 7 A small hepatocellular carcinoma demonstrates mild T2W hyperintensity (A), T1W hypointensity (B), arterial enhancement (C), portal venous phase washout (D) and hypointensity on the 20 min hepatobiliary phase (E) after injection with Gd-EOB-DTPA.
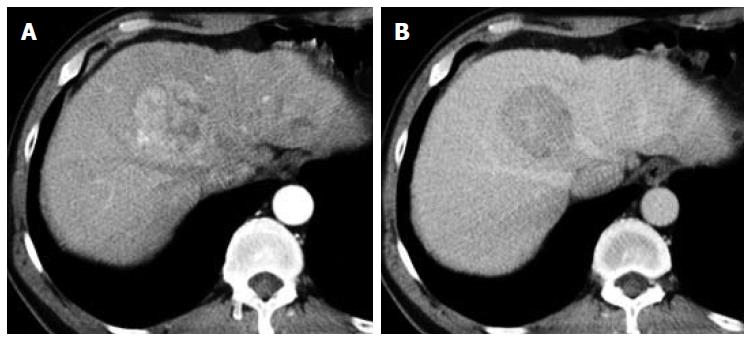
Figure 8 Mosaic attenuation is demonstrated on the arterial phase sequence (A) in this relatively large hepatocellular carcinoma followed by washout (B).
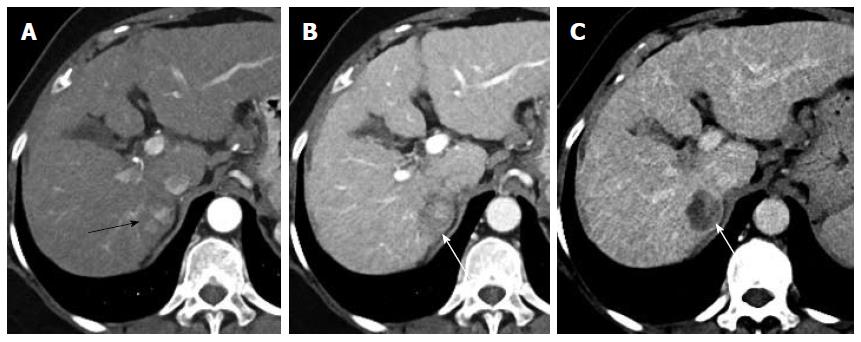
Figure 9 Cirrhotic liver with an arterially-enhancing lesion (black arrow) in segment 6 (A), which demonstrates a thin pseudocapsule (white arrow) in the portal venous (B) and delayed phases (C), better appreciated in the latter.
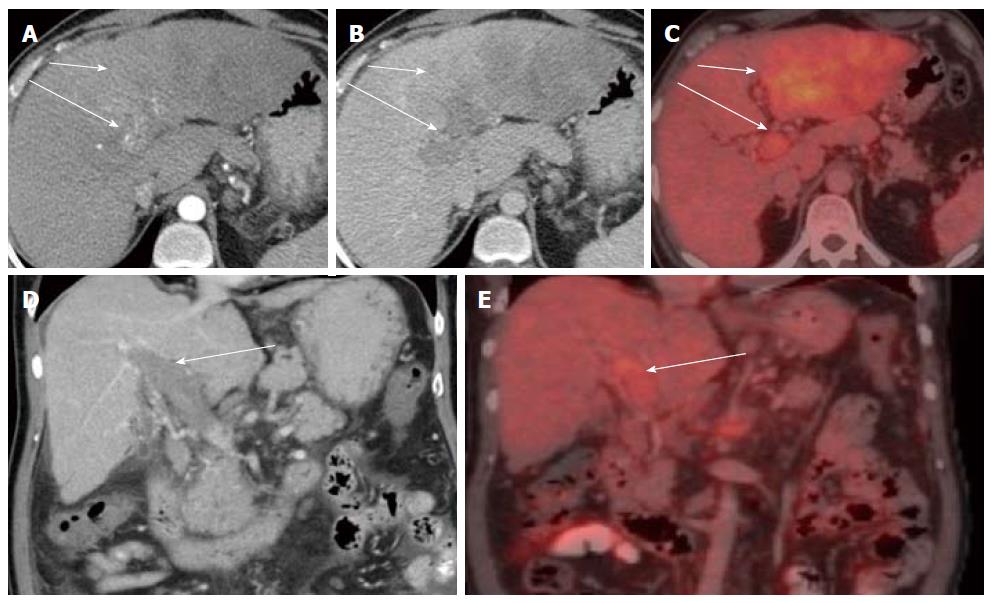
Figure 10 Vascular invasion.
A large ill-defined left lobe mass with no significant arterial enhancement (A) and washout in the portal venous phase (B). An FDG-PET CT was done which revealed uptake in the left lobe mass (C) consistent with a hypermetabolic tumour. Arterial enhancement is noted within the distended thrombus filled portal veins in (A) with subsequent washout (B) suggestive of tumour thrombus. The tumour thrombus also demonstrates increased uptake on FDG-PET (C). Coronal images better depict the distended thrombus filled portal vein (D) with increased uptake on PET/CT (E) (short arrow: tumour; long arrow: tumour thrombus). PET: Positron emission tomography; CT: Computed tomography; FDG: Fluoro-2-deoxy-D-glucose.
Figure 11 An iron-laden liver in a patient with hemochromatosis demonstrates a T2W hyperintense lesion (A) which is iron-free in the in- (B) and opposed (C) phases suggestive of hepatocellular carcinoma.
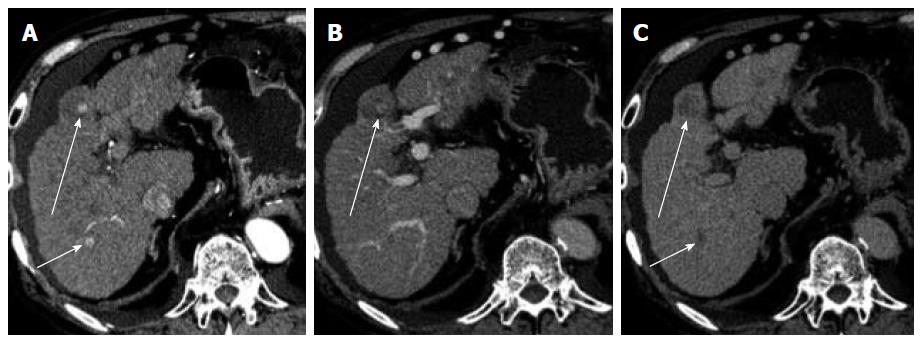
Figure 12 A focus of arterial enhancement is noted within a larger hypodense nodule (A) which demonstrates washout in the portal venous (B) and delayed (C) phases suggestive of development of hepatocellular carcinoma within a pre-existing cirrhosis-related nodule (long arrow).
Another focus of hepatocellular carcinoma (short arrow) is noted more posteriorly demonstrating arterial enhancement (A) and delayed phase wash-out (C).
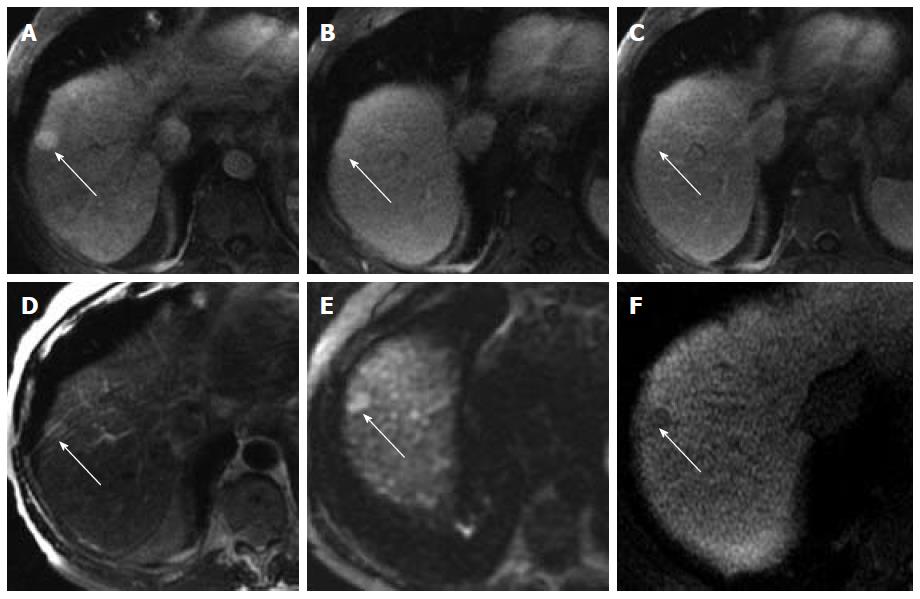
Figure 13 An initial study was performed using Gd-DTPA.
This showed an arterially-enhancing lesion (A) with no evidence of wash-out or pseudocapsule on the portal venous (B) or delayed (C) phases with hyperintensity on T2W (D) and DWI (E) sequences. A follow-up study acquired two months later with Gd-EOB-DTPA demonstrated a hypointense lesion on the hepatobiliary phase (F), increasing diagnostic confidence of hepatocellular carcinoma.
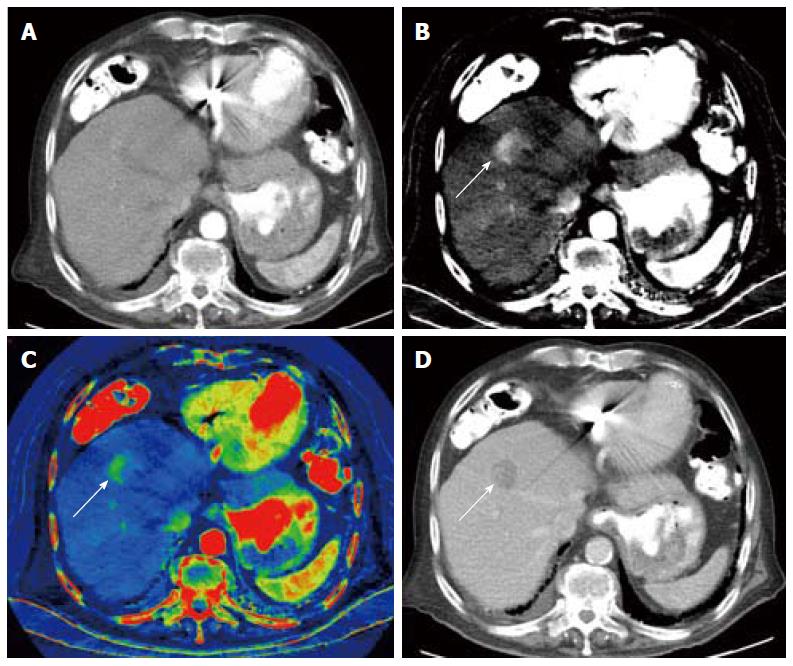
Figure 14 Dual-energy computed tomography of hepatocellular carcinoma.
Nodular outline is suggestive of cirrhosis, arterial phase single energy computed tomography (SECT) image acquired at 140kVp demonstrates a vague focus of arterial enhancement that is difficult to differentiate from surrounding liver parenchyma (A), arterial phase DECT material decomposition iodine (MD-I) image shows uptake of iodine independently from inherent tissue attenuation, clearly demonstrating a nodular hyperenhancing lesion (B), arterial phase color overlay MD-I image also depicts the lesion well (C). Portal venous phase SECT image acquired at 120 kVp demonstrates characteristic wash-out (D). MD-I images improve detection and characterization of this small hepatocellular carcinoma. (Courtesy of Drs. Andrea Prochowski and Dushyant Sahani, Massachusetts General Hospital, Boston, MA, United States).
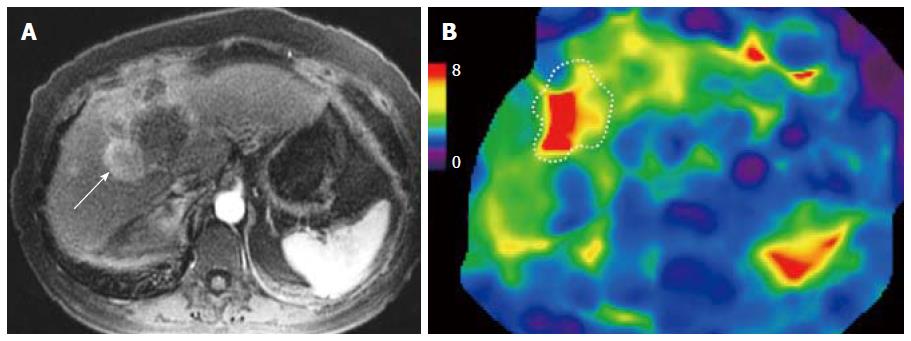
Figure 15 Magnetic resonance elastography of hepatocellular carcinoma.
Arterial phase image (A) and stiffness map (B) from magnetic resonance elastography. The color scale of the stiffness map is expressed in kilopascal (kPa). A case of chronic alcoholic liver disease with liver stiffness of 5.3 kPa consistent with cirrhosis. The enhancing hepatocellular carcinoma (white arrow) has mean stiffness of 8.2 kPa suspicious for a malignant tumour. Note the tumor is stiffer in the more hyper enhancing regions of the tumour.
- Citation: Hennedige T, Venkatesh SK. Advances in computed tomography and magnetic resonance imaging of hepatocellular carcinoma. World J Gastroenterol 2016; 22(1): 205-220
- URL: https://www.wjgnet.com/1007-9327/full/v22/i1/205.htm
- DOI: https://dx.doi.org/10.3748/wjg.v22.i1.205


