Copyright
©The Author(s) 2015.
World J Gastroenterol. Mar 7, 2015; 21(9): 2759-2769
Published online Mar 7, 2015. doi: 10.3748/wjg.v21.i9.2759
Published online Mar 7, 2015. doi: 10.3748/wjg.v21.i9.2759
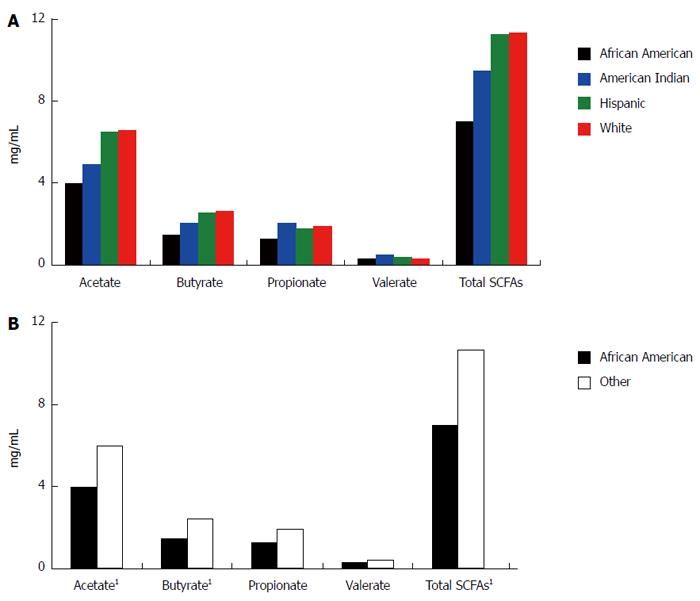
Figure 1 Levels of individual and total short chain fatty acids by race/ethnicity.
All values are in mg/mL of stool. A: The levels of short chain fatty acids (SCFAs) in stool across all four racial/ethnic groups; B: The levels of SCFAs for African Americans vs those of all other races/ethnicities. 1Statistically significant difference by independent samples t test, two sided, equal variances not assumed. Acetate: P = 0.045; Butyrate: P = 0.043; Total SCFAs: P = 0.039.
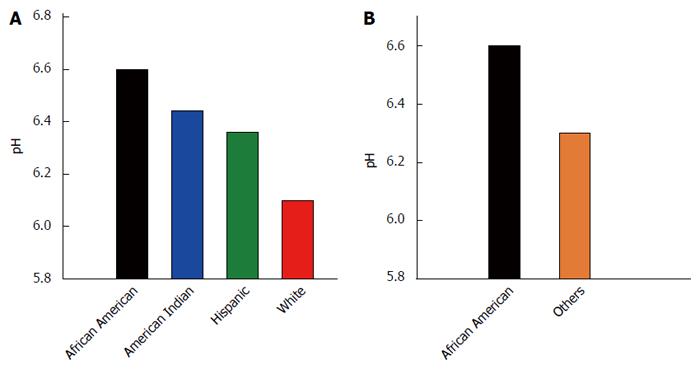
Figure 2 Stool pH by race/ethnicity.
A: Stool pH across all four racial/ethnic groups; B: Stool pH for African Americans vs those of all other races/ethnicities.
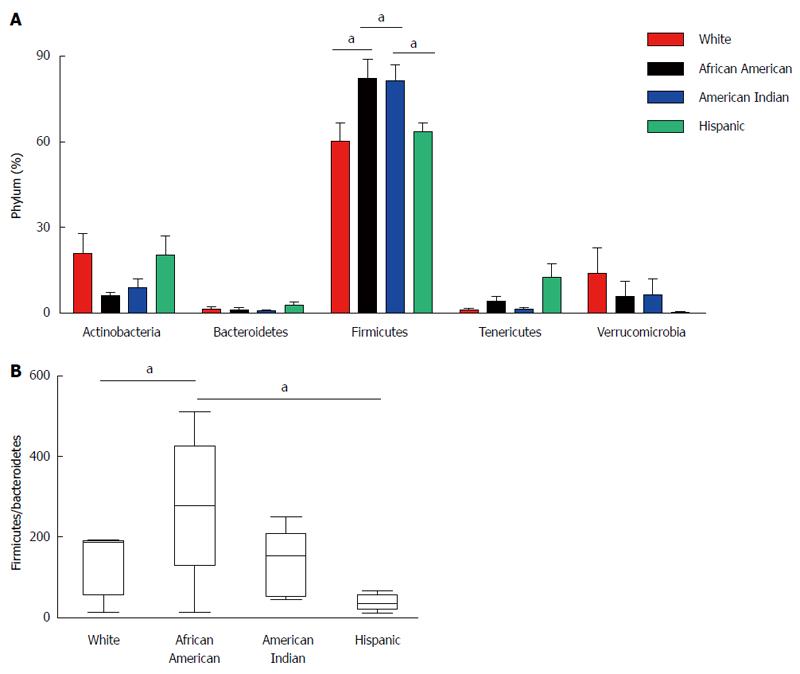
Figure 3 Human gut microbiota analysis from different racial/ethnic groups.
The 16S rRNA gene (v1-v3 regions) was sequenced from fecal samples using 454 Jr. sequencing and analyzed using QIIME platform. A: The phylum distribution among different groups was generated by comparing with the GreenGene (gg_otus-4feb2011) data base; B: The ratio of Firmicutes and Bacteroidetes is represented among different racial/ethnic groups. Statistics were performed using unpaired two-tailed t test using Graphpad Prism 4.0 software (aP < 0.05 vs control).
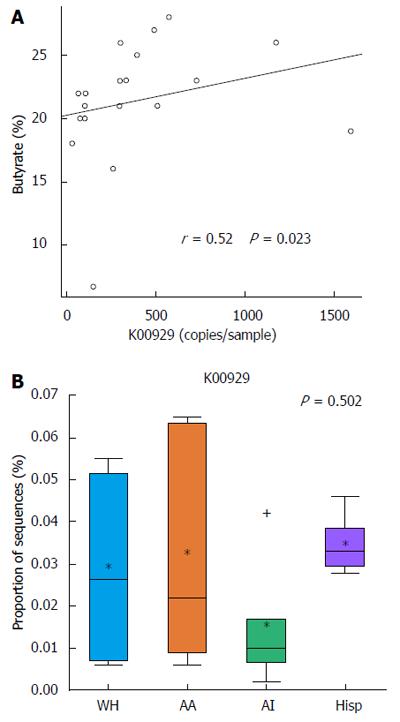
Figure 4 PICRUSt analysis of 16S rRNA and correlating with experimental butyrate levels.
A: Spearman Correlation analysis suggest moderately strong correlation (r = 0.52) prediction of K00929 pathway (butanoate pathway) vs experimental butyrate levels with significant P value (P = 0.023); B: Box plot indicating relative abundance of KO K00929 across ethnic groups (* = mean; + = points beyond 25th-75th percentile).
- Citation: Hester CM, Jala VR, Langille MG, Umar S, Greiner KA, Haribabu B. Fecal microbes, short chain fatty acids, and colorectal cancer across racial/ethnic groups. World J Gastroenterol 2015; 21(9): 2759-2769
- URL: https://www.wjgnet.com/1007-9327/full/v21/i9/2759.htm
- DOI: https://dx.doi.org/10.3748/wjg.v21.i9.2759


