Copyright
©The Author(s) 2015.
World J Gastroenterol. Mar 7, 2015; 21(9): 2739-2745
Published online Mar 7, 2015. doi: 10.3748/wjg.v21.i9.2739
Published online Mar 7, 2015. doi: 10.3748/wjg.v21.i9.2739
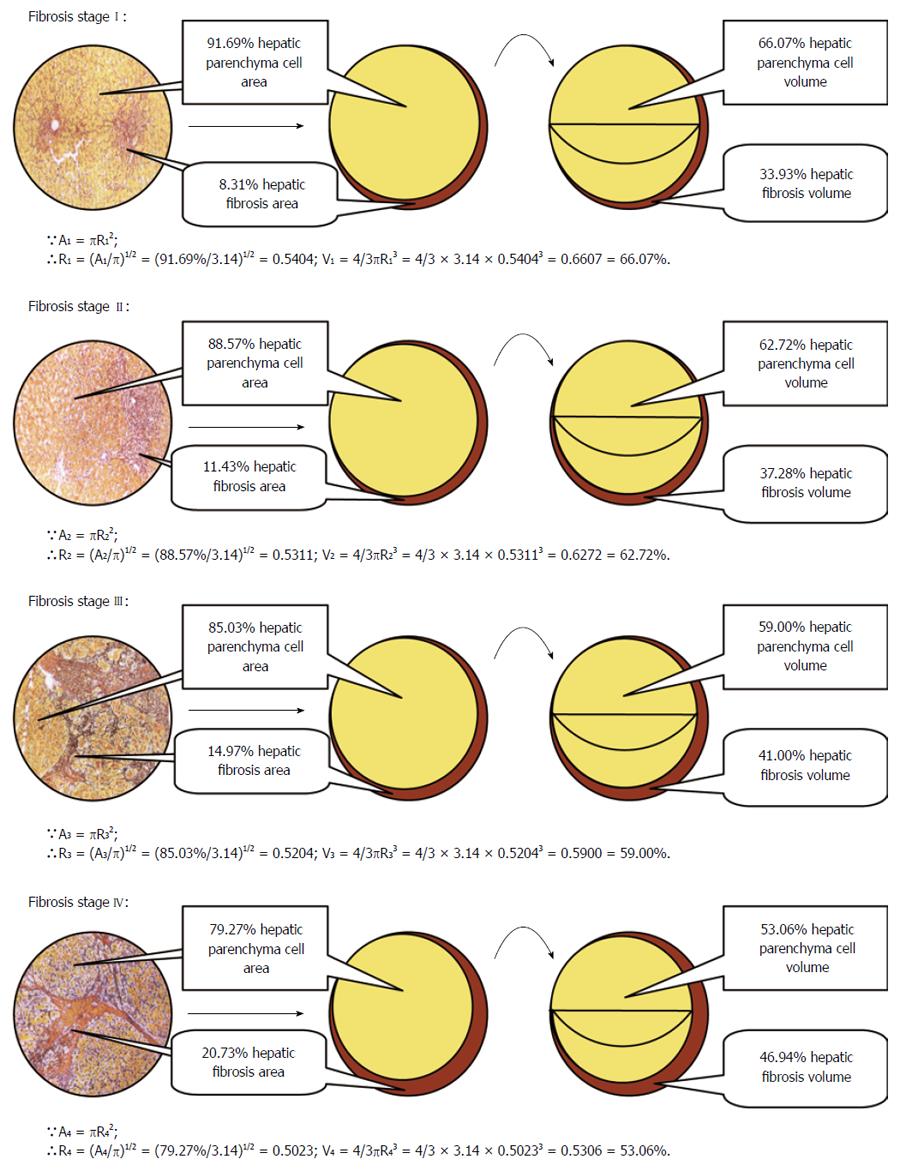
Figure 1 Sketch map of calculation of hepatic parenchyma cell volume.
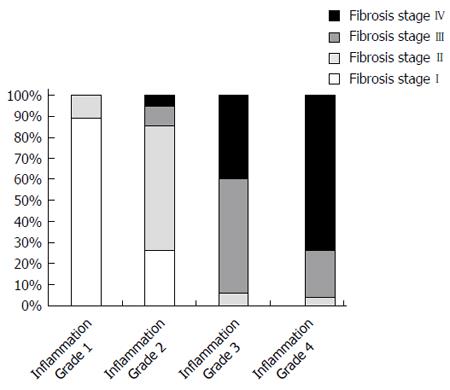
Figure 2 Distribution of liver inflammation grades and hepatic fibrosis stages in 160 hepatitis B e antigen-negative chronic hepatitis B patients.
χ2 = 187.635, P < 0.000.
- Citation: Wu ZQ, Tan L, Liu T, Gao ZL, Ke WM. Evaluation of changes of serum hepatitis B surface antigen from a different perspective. World J Gastroenterol 2015; 21(9): 2739-2745
- URL: https://www.wjgnet.com/1007-9327/full/v21/i9/2739.htm
- DOI: https://dx.doi.org/10.3748/wjg.v21.i9.2739


