Copyright
©The Author(s) 2015.
World J Gastroenterol. Feb 21, 2015; 21(7): 2249-2253
Published online Feb 21, 2015. doi: 10.3748/wjg.v21.i7.2249
Published online Feb 21, 2015. doi: 10.3748/wjg.v21.i7.2249
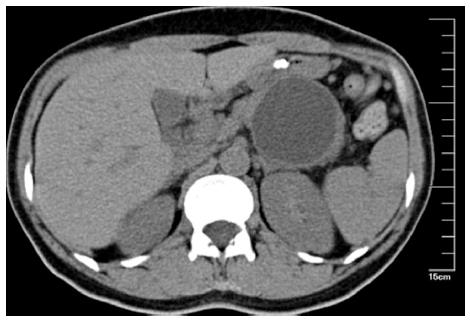
Figure 1 Abdominal contrast computed tomography scan of the lesion.
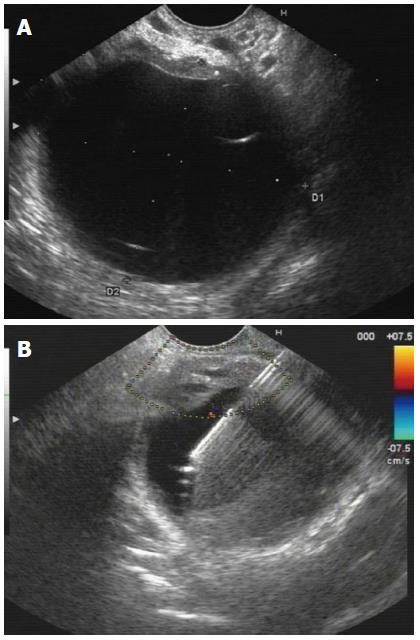
Figure 2 Endoscopic ultrasound.
A: Endoscopic ultrasound view of the lesion; B: Color Doppler ultrasonography was applied to identify the regional vasculature and used during endoscopic ultrasound-guided puncture.
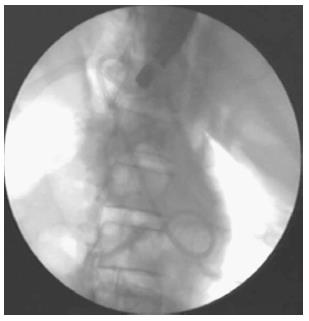
Figure 3 Fluoroscopic view during stent placement.
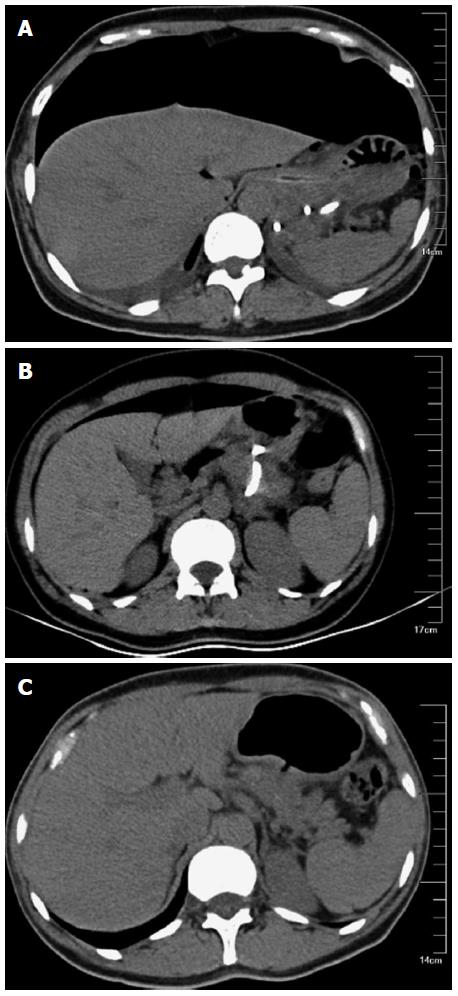
Figure 4 Computed tomography scan.
A: Showing stent migration and pneumoperitoneum after 3 d of the procedure; B: After 3 d of the stent removal and replacement; C: Twelve weeks later.
- Citation: Wang GX, Liu X, Wang S, Ge N, Guo JT, Liu W, Sun SY. Stent displacement in endoscopic pancreatic pseudocyst drainage and endoscopic management. World J Gastroenterol 2015; 21(7): 2249-2253
- URL: https://www.wjgnet.com/1007-9327/full/v21/i7/2249.htm
- DOI: https://dx.doi.org/10.3748/wjg.v21.i7.2249


