Copyright
©The Author(s) 2015.
World J Gastroenterol. Feb 21, 2015; 21(7): 2214-2219
Published online Feb 21, 2015. doi: 10.3748/wjg.v21.i7.2214
Published online Feb 21, 2015. doi: 10.3748/wjg.v21.i7.2214
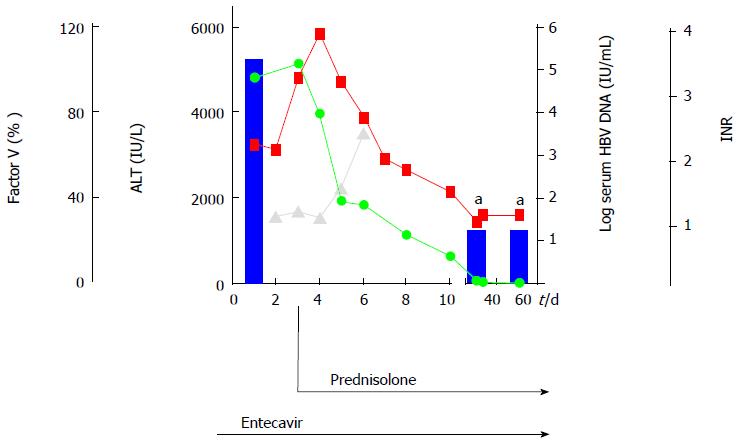
Figure 1 Acute hepatitis B virus infection.
Levels of alanine amino transferase in IU/L (green points), International normalized ratio (red points), Factor V in % (grey points) and hepatitis B virus (HBV) viremia in IU/mL (blue bars) are shown in the time frame of acute HBV infection. Additional prednisolone therapy was started at the indicated time point. aHBV-DNA-levels under detection limit.
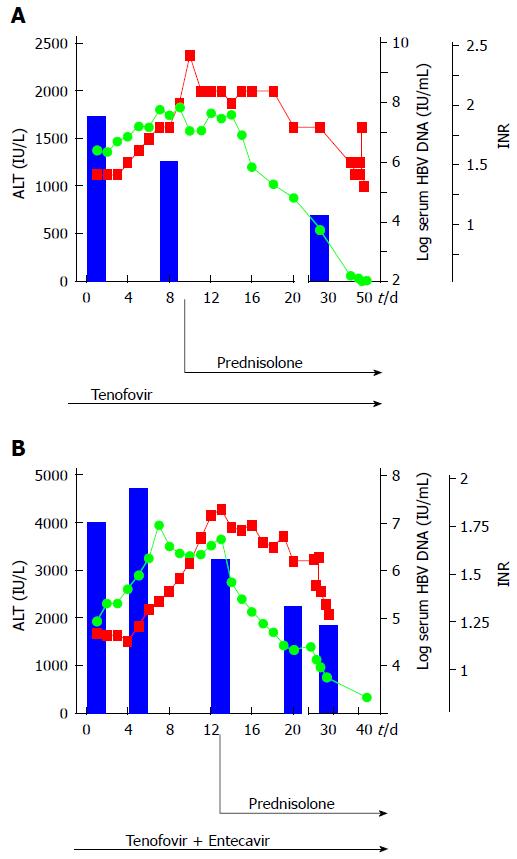
Figure 2 Hepatitis B virus reactivation after chemotherapy.
Levels of alanine amino transferase in IU/L (green points), International normalized ratio (red points) and hepatitis B virus (HBV) viremia in IU/mL (blue bars) are shown in the case of HBV reactivation after rituximab and bendamustin chemotherapy (2A) and HBV reactivation after R-CHOP therapy and after early cessation of pre-emptive tenofovir therapy (2B). Additional prednisolone therapy was started at the indicated time points.
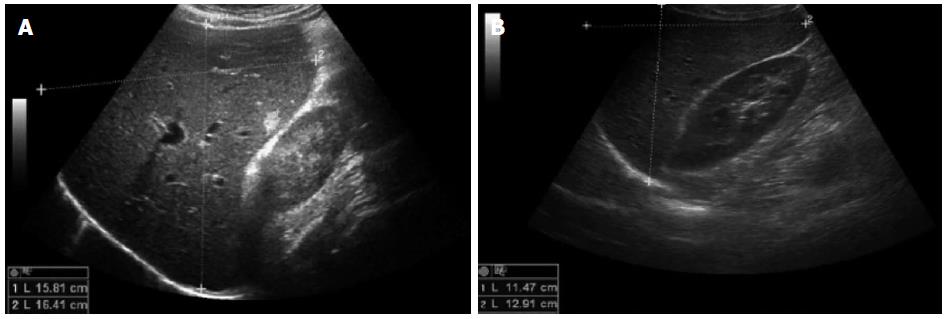
Figure 3 Ultrasound images of patient N.
2B before (A) and after (B) combined glucocorticoid and entecavir/tenofovir therapy. Liver diameters are documented in the midclavicular line: 15.8 cm x 16.4 cm, hepatomegaly (A) and 11.5 cm x 12.9 cm (B). Additional finding: 1 cm hemangioma.
- Citation: Bockmann JH, Dandri M, Lüth S, Pannicke N, Lohse AW. Combined glucocorticoid and antiviral therapy of hepatitis B virus-related liver failure. World J Gastroenterol 2015; 21(7): 2214-2219
- URL: https://www.wjgnet.com/1007-9327/full/v21/i7/2214.htm
- DOI: https://dx.doi.org/10.3748/wjg.v21.i7.2214


