Copyright
©The Author(s) 2015.
World J Gastroenterol. Feb 21, 2015; 21(7): 2080-2088
Published online Feb 21, 2015. doi: 10.3748/wjg.v21.i7.2080
Published online Feb 21, 2015. doi: 10.3748/wjg.v21.i7.2080
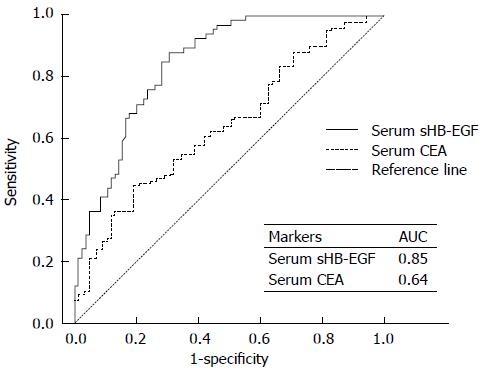
Figure 1 Receiver operating characteristic curve for serum soluble heparin-binding epidermal growth factor-like growth factor compared with the curve for serum carcinoembryonic antigen to predict gastric cancer.
ROC: Receiver operating curve; sHB-EGF: Soluble heparin-binding epidermal growth factor-like growth factor; CEA: Carcinoembryonic antigen; AUC: Area under the ROC curve.
- Citation: Chung HW, Kong HY, Lim JB. Clinical significance and usefulness of soluble heparin binding-epidermal growth factor in gastric cancer. World J Gastroenterol 2015; 21(7): 2080-2088
- URL: https://www.wjgnet.com/1007-9327/full/v21/i7/2080.htm
- DOI: https://dx.doi.org/10.3748/wjg.v21.i7.2080


