Copyright
©The Author(s) 2015.
World J Gastroenterol. Feb 21, 2015; 21(7): 2030-2039
Published online Feb 21, 2015. doi: 10.3748/wjg.v21.i7.2030
Published online Feb 21, 2015. doi: 10.3748/wjg.v21.i7.2030
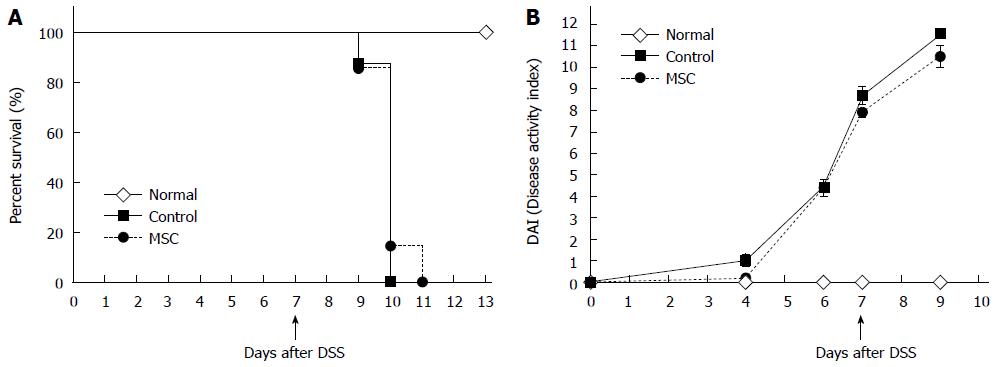
Figure 1 Survival and disease activity index scores.
A: Survival after dextran sulfate sodium (DSS) administration (n = 8, all tests were performed in triplicate); B: Disease activity index scores (which consider weight loss, stool consistency, and the extent of rectal bleeding) after DSS administration (n = 10, all tests were performed in triplicate). MSC: Mesenchymal stem cells.
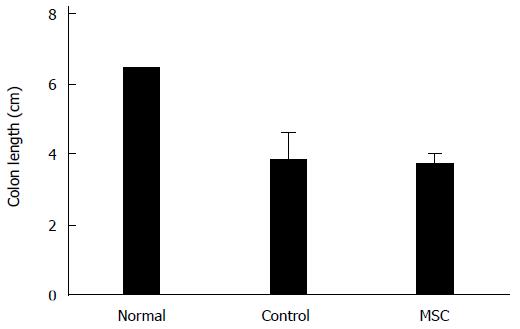
Figure 2 Colon lengths.
Colon lengths (from the appendix to the anus) in normal, control and mesenchymal stem cell (MSC)-treated groups (n = 2, all tests were performed in triplicate).
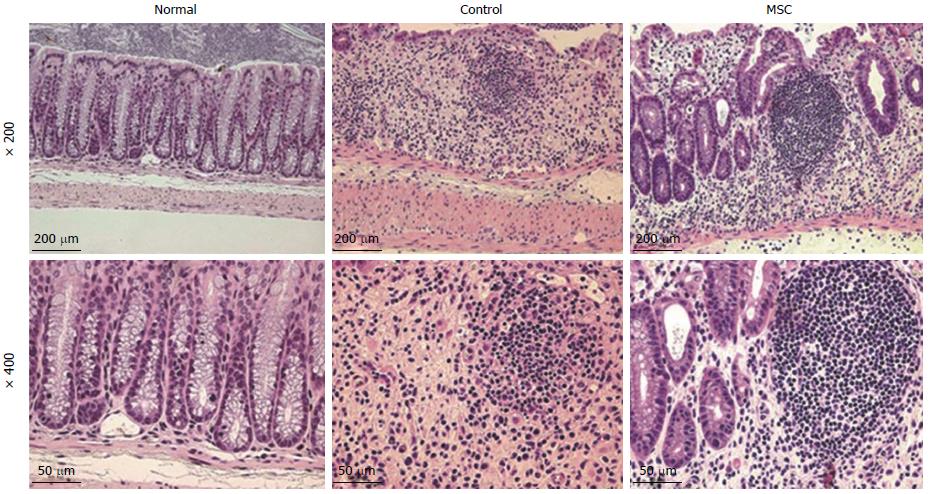
Figure 3 Histopathologic changes in the colon after mesenchymal stem cell infusion.
Hematoxylin and eosin staining showed symptoms of colon damage in control and mesenchymal stem cell (MSC)-treated groups, but not in the normal group.
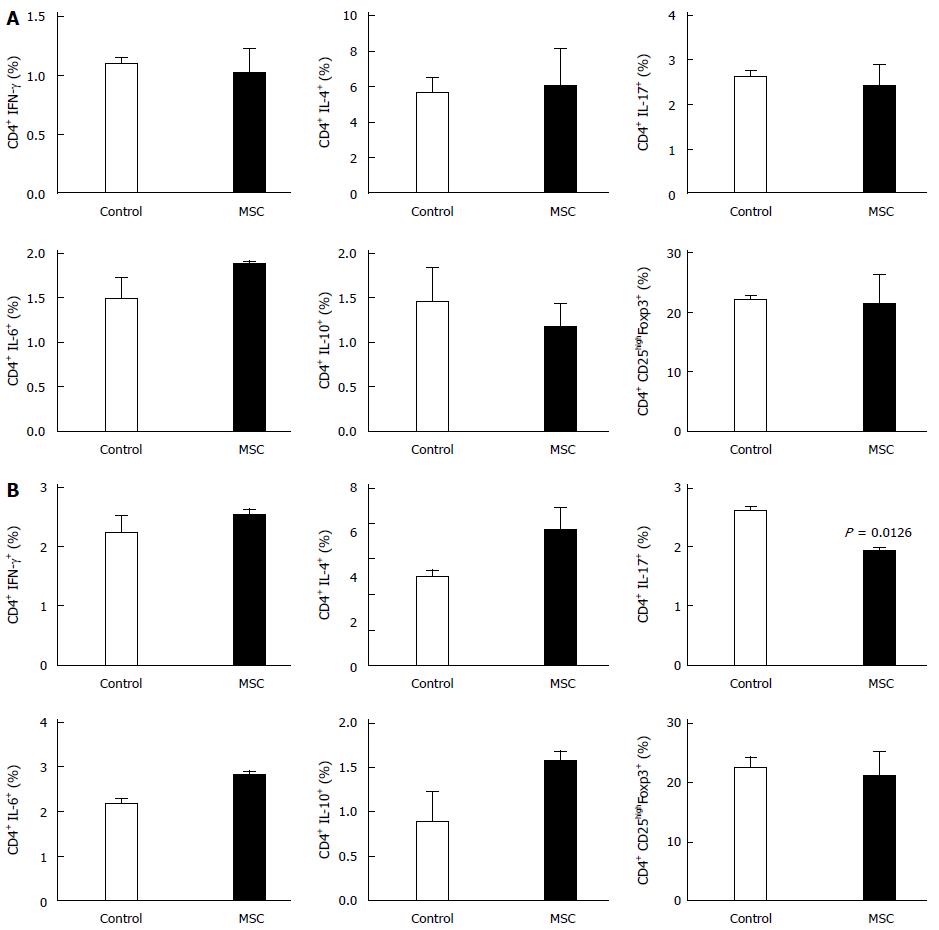
Figure 4 Changes in cytokine expression in the spleen and mesenteric lymph nodes.
The percentages of cells expressing interferon (IFN)-γ, interleukin (IL)-4, IL-6, IL-10, and IL-17, and Treg cells in the Spleen (A) and Mesenteric lymph nodes (B) (n = 2, all tests were performed in triplicate). MSC: Mesenchymal stem cells.
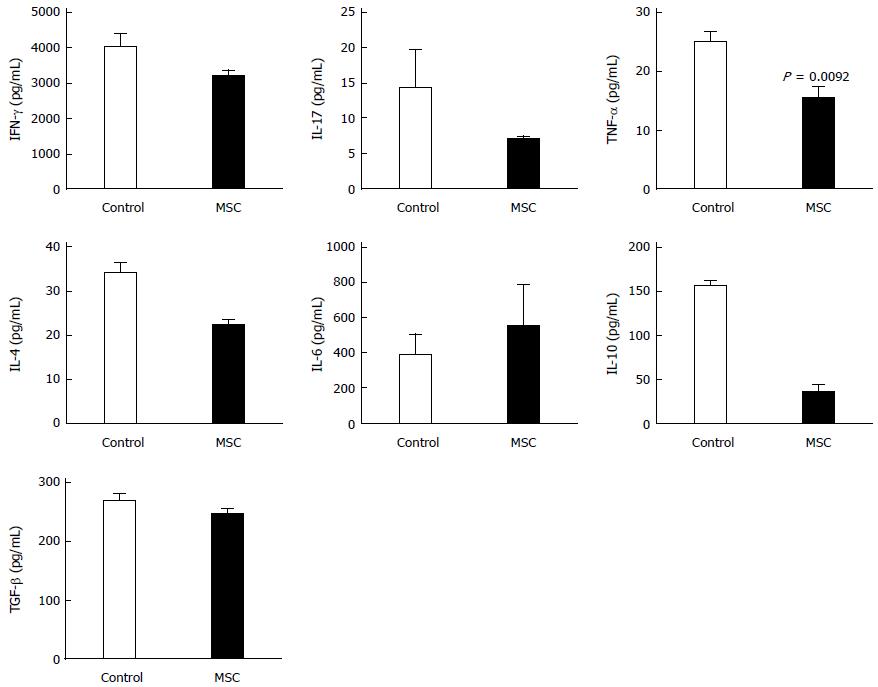
Figure 5 Changes in cytokine levels in the colon.
Mice colons were harvested and the levels of interferon (IFN)-γ, interleukin (IL)-4, IL-6, IL-10, IL-17, and TNF-α were measured by ELISA (n = 2; all tests were performed in triplicate).
- Citation: Nam YS, Kim N, Im KI, Lim JY, Lee ES, Cho SG. Negative impact of bone-marrow-derived mesenchymal stem cells on dextran sulfate sodium-induced colitis. World J Gastroenterol 2015; 21(7): 2030-2039
- URL: https://www.wjgnet.com/1007-9327/full/v21/i7/2030.htm
- DOI: https://dx.doi.org/10.3748/wjg.v21.i7.2030


