Copyright
©The Author(s) 2015.
World J Gastroenterol. Feb 14, 2015; 21(6): 1880-1886
Published online Feb 14, 2015. doi: 10.3748/wjg.v21.i6.1880
Published online Feb 14, 2015. doi: 10.3748/wjg.v21.i6.1880
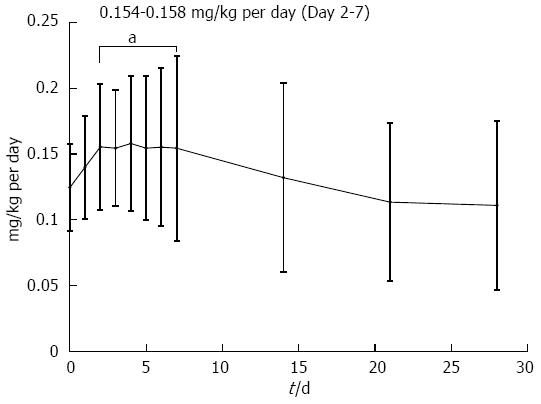
Figure 1 Daily dosage of oral tacrolimus.
aP < 0.05 vs day 0.
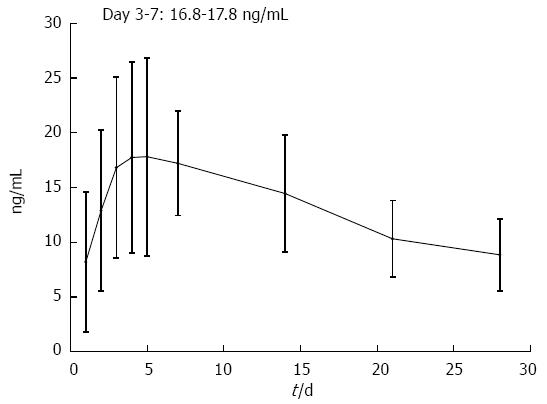
Figure 2 Mean trough whole-blood levels.
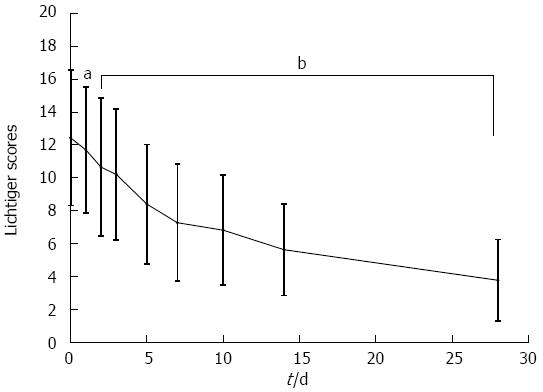
Figure 3 Evolution of Lichtiger scores following treatment with oral tacrolimus.
aP < 0.05 vs day 0, bP < 0.01 vs day 0.
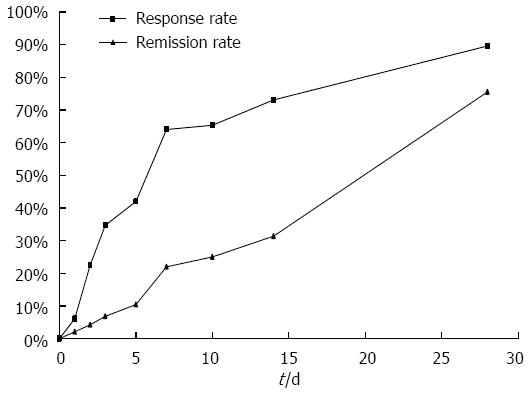
Figure 4 Clinical responses following treatment with oral tacrolimus.
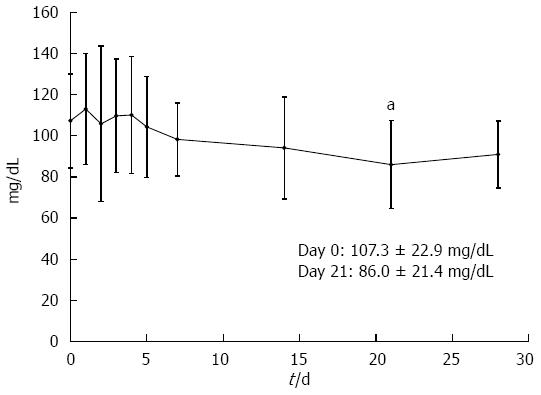
Figure 5 Blood glucose level following treatment with oral tacrolimus.
aP < 0.05 vs day 0.
- Citation: Kawakami K, Inoue T, Murano M, Narabayashi K, Nouda S, Ishida K, Abe Y, Nogami K, Hida N, Yamagami H, Watanabe K, Umegaki E, Nakamura S, Arakawa T, Higuchi K. Effects of oral tacrolimus as a rapid induction therapy in ulcerative colitis. World J Gastroenterol 2015; 21(6): 1880-1886
- URL: https://www.wjgnet.com/1007-9327/full/v21/i6/1880.htm
- DOI: https://dx.doi.org/10.3748/wjg.v21.i6.1880


