Copyright
©The Author(s) 2015.
World J Gastroenterol. Feb 14, 2015; 21(6): 1784-1793
Published online Feb 14, 2015. doi: 10.3748/wjg.v21.i6.1784
Published online Feb 14, 2015. doi: 10.3748/wjg.v21.i6.1784
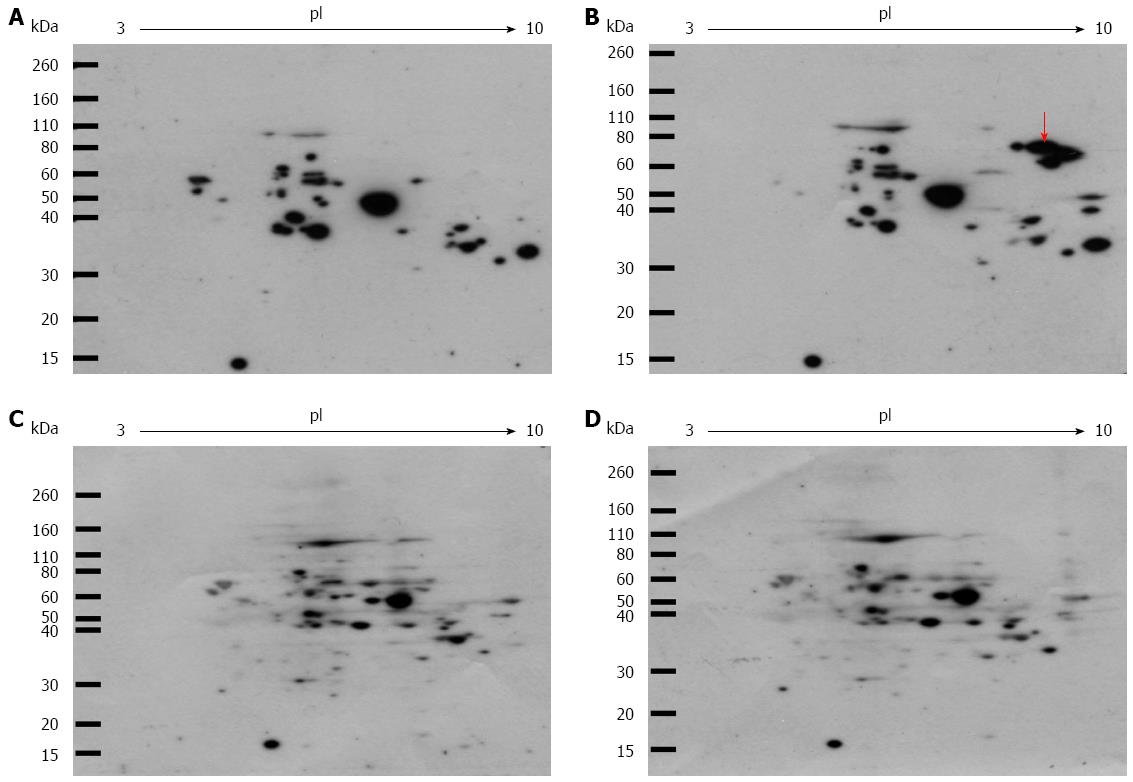
Figure 1 Western blot analysis of intracellular glyceraldehyde-derived advanced glycation end-products.
Cells were incubated with or without 2 mmol/L fructose for 5 d. Cell lysates (100 μg of protein/gel) were separated on two-dimensional gradient sodium dodecyl sulfate-polyacrylamide electrophoresis and probed with Anti-glyceraldehyde-derived advanced glycation end-products (Glycer-AGEs) antibody (A, B), or anti-Glycer-AGEs antibody neutralized by an excess of Glycer-AGEs-bovine serum albumin (C, D); A,C: control samples; B,D: Fructose samples. The arrow shows spots where a difference was seen.
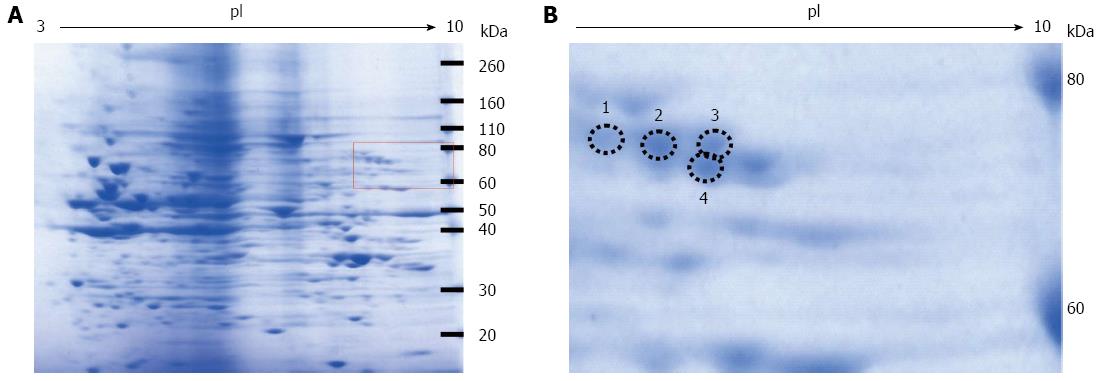
Figure 2 Coomassie blue staining of the two-dimensional gradient gel.
A: High fructose exposure samples were separated on two-dimensional gradient sodium dodecyl sulfate-polyacrylamide electrophoresis and then stained with EzStain Aqua; B: Higher magnification of the square region of the left panel. The number and the position of the four selected spots are indicated by circles.
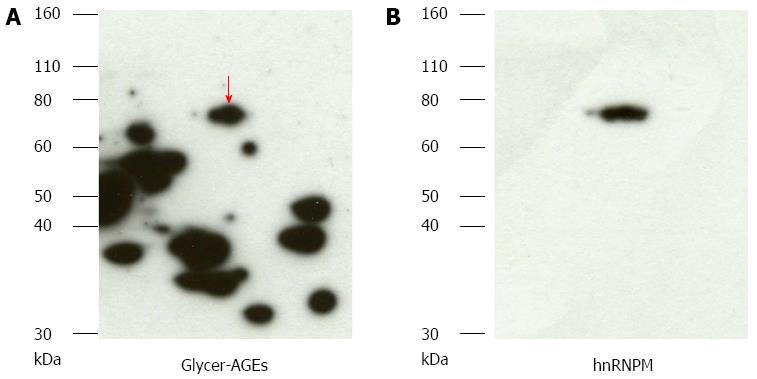
Figure 3 Detection of glyceraldehyde modification of heterogeneous nuclear ribonucleoprotein M by high fructose exposure.
A: Samples exposed to high fructose concentrations were separated on two-dimensional gradient sodium dodecyl sulfate-polyacrylamide electrophoresis and probed with anti-glyceraldehyde-derived advanced glycation end-products (Glycer-AGEs) antibody. The arrow shows spots where a difference was seen; B: They were reprobed with heterogeneous nuclear ribonucleoprotein M (hnRNPM) antibody.
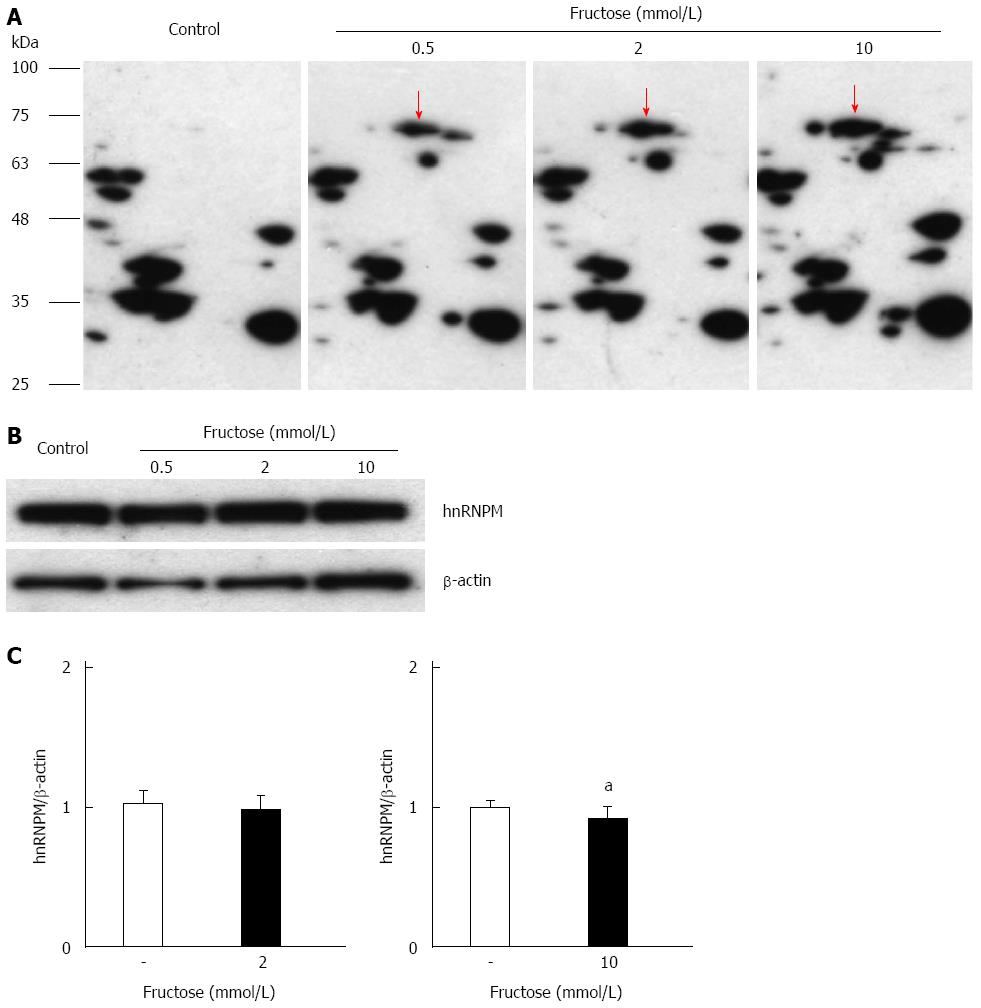
Figure 4 Effects of glyceraldehyde modification of heterogeneous nuclear ribonucleoprotein M by high fructose exposure.
Cells were incubated with 0.5-10.0 mmol/L fructose for 5 d. A: Cell lysates were separated on two-dimensional gradient sodium dodecyl sulfate-polyacrylamide electrophoresis (SDS-PAGE) and the glyceraldehyde modification of heterogeneous nuclear ribonucleoprotein M (hnRNPM) was determined by probing with anti-Glycer-AGEs antibody. The arrow shows spots identified with hnRNPM; B: Cell lysates were separated by SDS-PAGE and probed with anti-hnRNPM antibody. Equal protein loading was determined using anti-β-actin antibody; C: The levels of mRNA expression were analyzed by real-time RT-PCR, and the result was normalized to β-actin. Data are shown as mean ± SD (n = 6); aP < 0.05 vs control. Left panel: With 2 mmol/L fructose, right panel: With 10 mmol/L fructose.
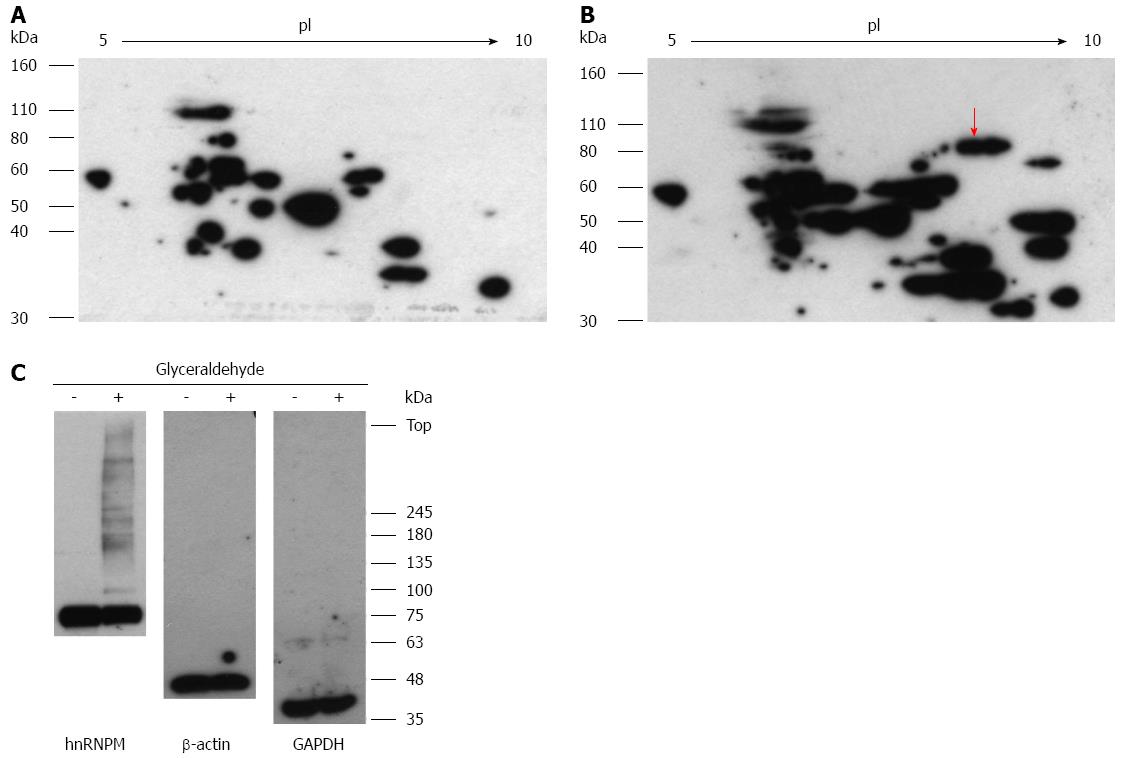
Figure 5 Effects of glyceraldehyde modification of heterogeneous nuclear ribonucleoprotein M.
Hep3B cells were incubated for 5 d and incubated with or without 4 mmol/L glyceraldehyde for 6 h. Cell lysates were separated on two-dimensional gradient sodium dodecyl sulfate-polyacrylamide electrophoresis (SDS-PAGE) (A, B); or SDS-PAGE and probed with anti-Glycer-AGEs antibody (C). A: Control sample; B: Glyceraldehyde sample. The arrow shows spot identified with heterogeneous nuclear ribonucleoprotein M (hnRNPM).
-
Citation: Takino JI, Nagamine K, Takeuchi M, Hori T.
In vitro identification of nonalcoholic fatty liver disease-related protein hnRNPM. World J Gastroenterol 2015; 21(6): 1784-1793 - URL: https://www.wjgnet.com/1007-9327/full/v21/i6/1784.htm
- DOI: https://dx.doi.org/10.3748/wjg.v21.i6.1784


