Copyright
©The Author(s) 2015.
World J Gastroenterol. Feb 7, 2015; 21(5): 1444-1456
Published online Feb 7, 2015. doi: 10.3748/wjg.v21.i5.1444
Published online Feb 7, 2015. doi: 10.3748/wjg.v21.i5.1444
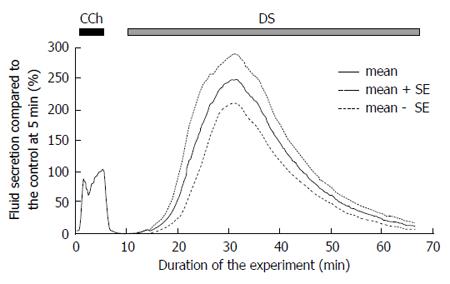
Figure 1 Time course of the Danshen-induced salivary fluid secretion.
After control stimulation with 0.2 μmol/L CCh for 5 min, DS (5 g/L) was introduced at 10 min and perfused for 60 min. Respectively, the bold and dotted lines show the average values and the mean ± SE of the salivary fluid secretion of 9 glands. DS: Danshen; CCh: Carbamylcholine.
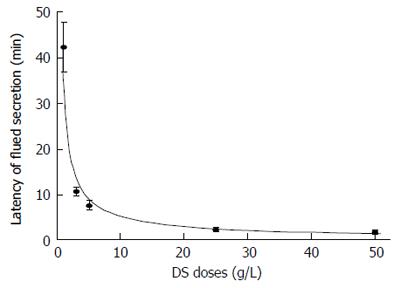
Figure 2 The latency of stimulation with different doses of Danshen.
The latency of the fluid secretion was shown as the mean ± SE for different DS doses. The latency reduced as the dose of DS increased. DS: Danshen.
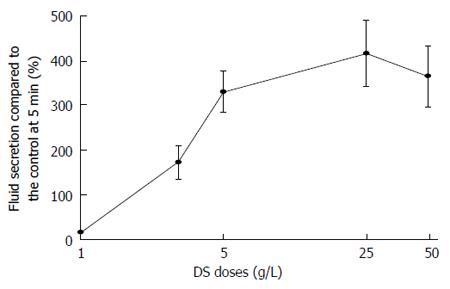
Figure 3 Dose response of the highest Danshen-induced fluid secretion.
The highest fluid secretion was shown as mean ± SE and the doses of DS employed were 1, 3, 5, 25 and 50 g/L, respectively. The fluid secretion increased from 1 g/L to 25 g/L, and reached a plateau level at the higher doses. DS: Danshen.
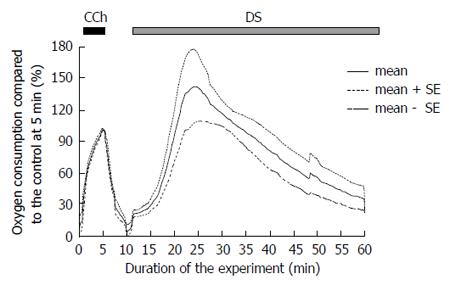
Figure 4 Time course of the A-V difference of partial oxygen pressure during the Danshen perfusion.
CCh stimulation was conducted for 5 min. as a control measure. At 10 min., DS was added and perfused for 30 min. This figure shows the average values (bold line, n = 5 glands) and the standard error of the means (mean ± SE, dotted lines). DS: Danshen; CCh: Carbamylcholine.
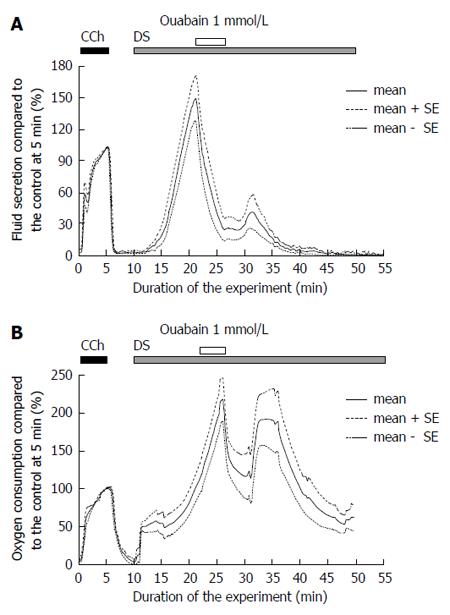
Figure 5 Inactivation of Na+/K+ ATPase by ouabain.
A: Danshen-induced salivary fluid secretion. CCh stimulation was conducted for 5 min as control measure. At 20 min ouabain was added for 5 min, and the DS-induced fluid secretion decreased significantly (P < 0.05 vs control). The figure shows the average (bold line, n = 5) and the standard error of the means (mean ± SE, dotted lines); B: Oxygen consumption during DS stimulation. At 25 min ouabain was added for 5 min, and the oxygen consumption decreased significantly (P < 0.05 vs control). This figure shows the average values (bold line, n = 5) and the standard error of the means (mean ± SE, dotted lines). DS: Danshen; CCh: Carbamylcholine.
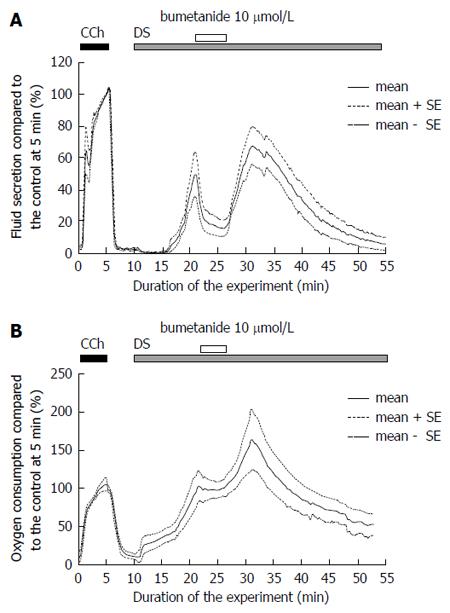
Figure 6 Inactivation of NKCC1 by bumetanide.
A: The effects of bumetanide on Danshen-induced salivary fluid secretion. Initially, CCh was added for 5 min as a control measure. At 20 min bumetanide was added for 5 min, and the fluid secretion decreased significantly to a plateau inhibited level (P < 0.05 vs control). This figure shows the average values (bold line, n = 6) and the standard error of the means (mean ± SE, dotted lines); B. The effects of bumetanide on DS-induced oxygen consumption. The oxygen consumption was shown by arterio-venous difference of partial oxygen pressure (mmHg). Initially, CCh was added for 5 min as a control measure. At 20 min bumetanide was added for 5 min. DS: Danshen; CCh: Carbamylcholine.
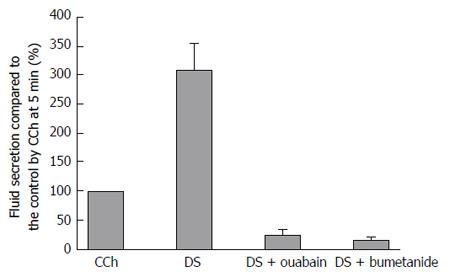
Figure 7 The residual Danshen-induced fluid secretion during inhibition due to ouabain or bumetanide.
This figure shows the standard error of the means (mean ± SE) of the salivary fluid secretion. Ouabain (inhibitor of Na+/K+ ATPase) and bumetanide (inhibitor of NKCC1) decreased the fluid secretion due to the DS (n = 9). The DS column indicates the maximum response of the fluid secretion due to DS. DS: Danshen; CCh: Carbamylcholine.
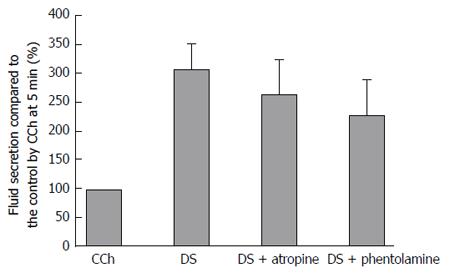
Figure 8 Effects of atropine and phentolamine on the Danshen-induced fluid secretion.
The standard error of the means (mean ± SE) of the highest fluid secretion was shown in the DS only group (n = 9), the DS with atropine (n = 7), and the DS with phentolamine (n = 14). n shows the number of the glands employed. The values were expressed as percentage of the fluid secretion rate at 5 min with CCh as control. There was no significant differences (P > 0.5 vs control) among the 3 groups. DS: Danshen; CCh: Carbamylcholine.
- Citation: Wei F, Wei MX, Murakami M. Mechanism involved in Danshen-induced fluid secretion in salivary glands. World J Gastroenterol 2015; 21(5): 1444-1456
- URL: https://www.wjgnet.com/1007-9327/full/v21/i5/1444.htm
- DOI: https://dx.doi.org/10.3748/wjg.v21.i5.1444


