Copyright
©The Author(s) 2015.
World J Gastroenterol. Dec 14, 2015; 21(46): 13124-13131
Published online Dec 14, 2015. doi: 10.3748/wjg.v21.i46.13124
Published online Dec 14, 2015. doi: 10.3748/wjg.v21.i46.13124
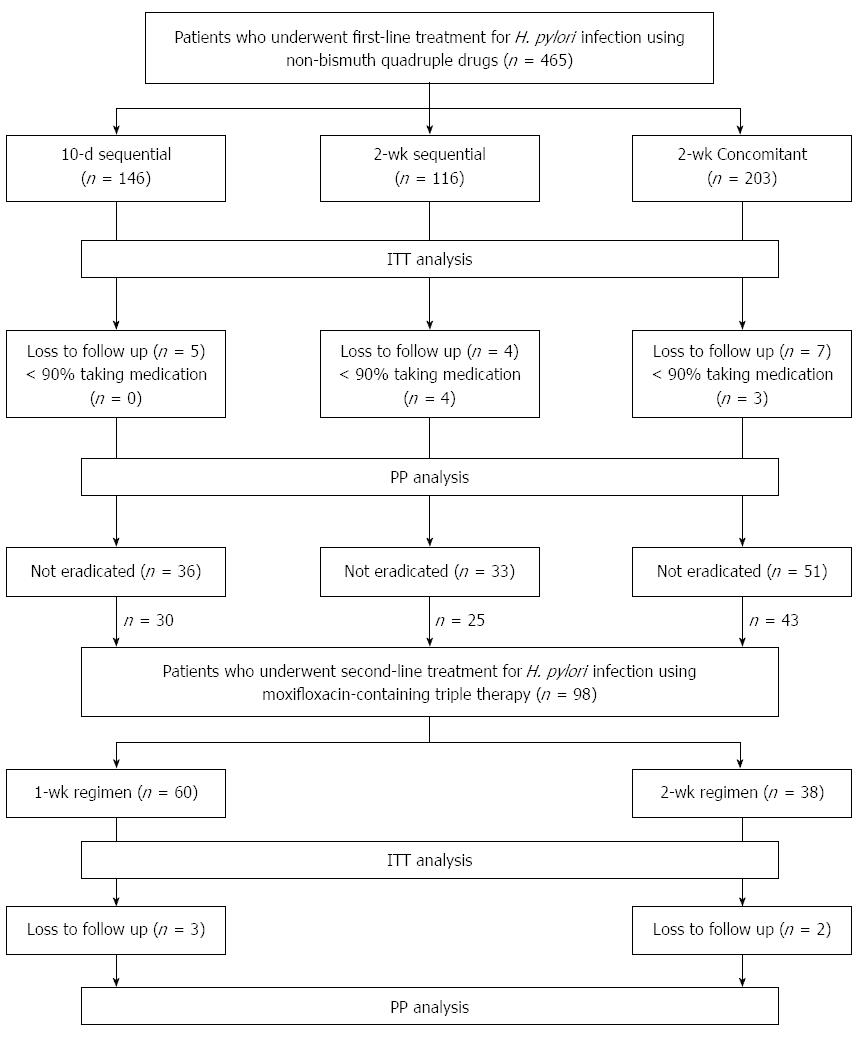
Figure 1 Profile of the first-line and second-line treatment for Helicobacter pylori infection.
ITT: Intention-to-treat; PP: Per-protocol; H. pylori: Helicobacter pylori.
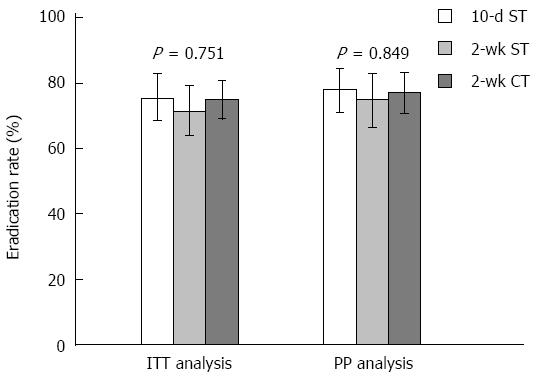
Figure 2 Helicobacter pylori eradication rates of first-line treatment using non-bismuth quadruple sequential and concomitant therapies.
Error bars indicate 95%CI. 10-d ST: Ten-day sequential therapy; 2-wk ST: Two-weeks sequential therapy; 2-wk CT: Two-weeks concomitant therapy; ITT: Intention-to-treat; PP: Per-protocol.
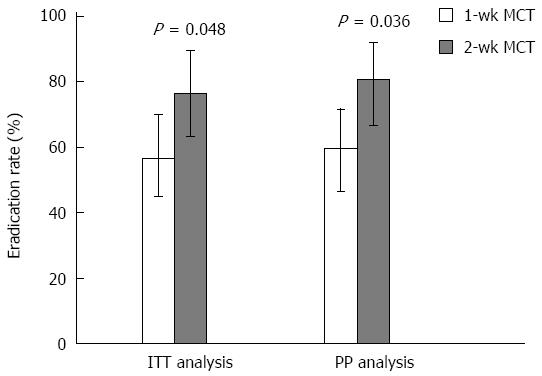
Figure 3 Helicobacter pylori eradication rates of second-line treatment using 1-wk and 2-wk moxifloxacin-containing triple therapy.
Error bars indicate 95%CI. 1-wk MCT: One-week moxifloxacin-containing triple therapy; 2-wk MCT: Two-weeks moxifloxacin-containing triple therapy; ITT: Intention-to-treat; PP: Per-protocol.
-
Citation: Lim JH, Lee DH, Lee ST, Kim N, Park YS, Shin CM, Song IS. Moxifloxacin-containing triple therapy after non-bismuth quadruple therapy failure for
Helicobacter pylori infection. World J Gastroenterol 2015; 21(46): 13124-13131 - URL: https://www.wjgnet.com/1007-9327/full/v21/i46/13124.htm
- DOI: https://dx.doi.org/10.3748/wjg.v21.i46.13124


