Copyright
©The Author(s) 2015.
World J Gastroenterol. Dec 14, 2015; 21(46): 13004-13019
Published online Dec 14, 2015. doi: 10.3748/wjg.v21.i46.13004
Published online Dec 14, 2015. doi: 10.3748/wjg.v21.i46.13004
Figure 1 siHuR silencing efficiency in pancreatic cancer cells.
siHuR silencing efficiency was evaluated by western blot analysis 72 h after transfection. HuR: Human antigen R.
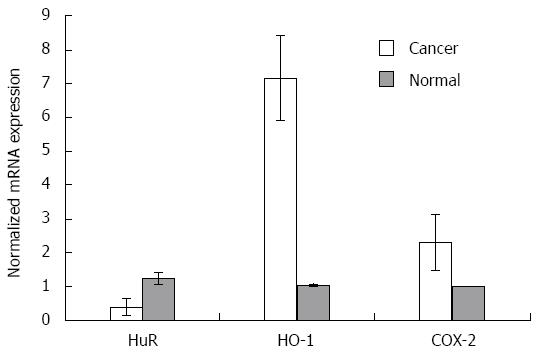
Figure 2 HuR, HO-1 and COX-2 mRNA expression analysis in tissues.
Quantitative reverse transcription polymerase chain reaction (qRT-PCR) analysis revealed normalized HuR, HO-1, and COX-2 mRNA expression in normal tissues (n = 6) compared to pancreatic cancer tissues (n = 20) with standard deviation (P < 0.05). For normalization, β-actin housekeeping gene and ΔΔCt method was used. HO-1: Heme oxygenase-1; COX-2: Cyclooxygenase-2; HuR: Human antigen R.
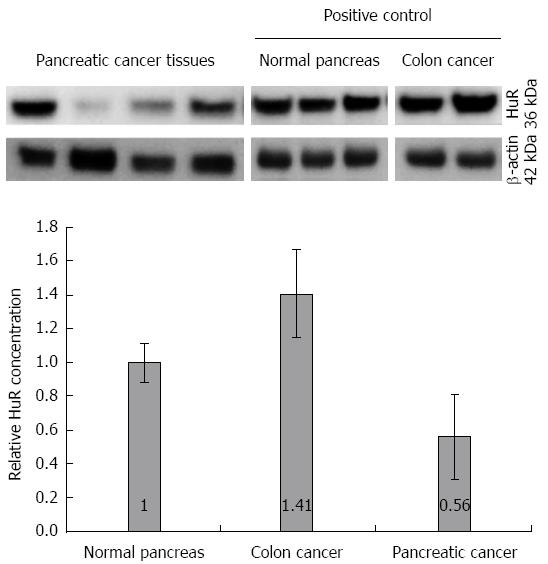
Figure 3 Human antigen R protein expression analysis in tissues.
Quantitative western blot analysis revealed 1.8-fold higher expression of HuR in normal pancreas tissues compared to pancreatic cancer tissues. Colon cancer tissue was used as a positive control. HuR: Human antigen R.
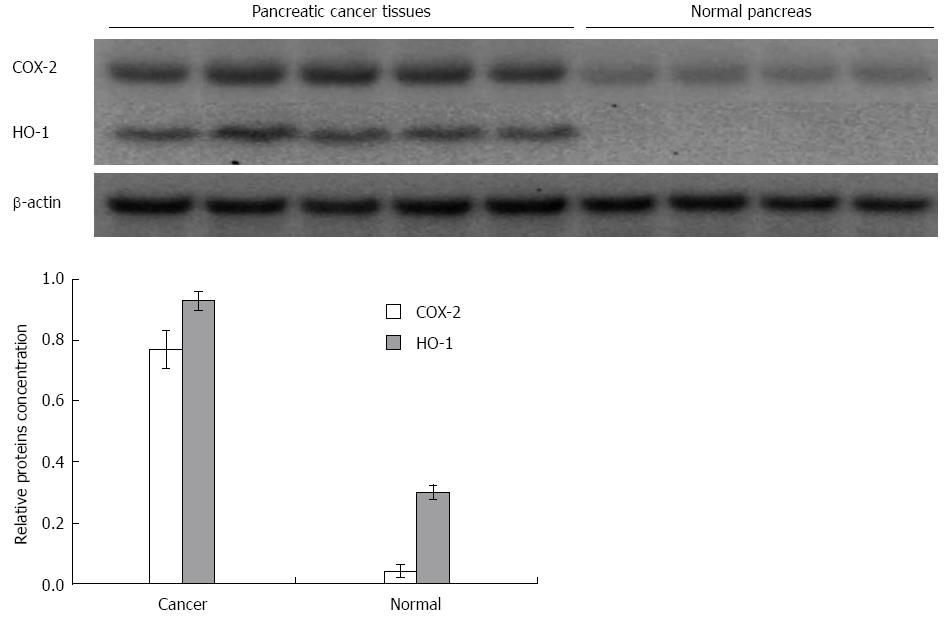
Figure 4 COX-2 and HO-1 protein expression analysis in tissues.
Expression of COX-2 and HO-1 proteins was, accordingly, 3.2 and 10.8-fold higher in pancreatic cancer tissue compared to normal pancreatic tissue. HO-1: Heme oxygenase-1; COX-2: Cyclooxygenase-2.
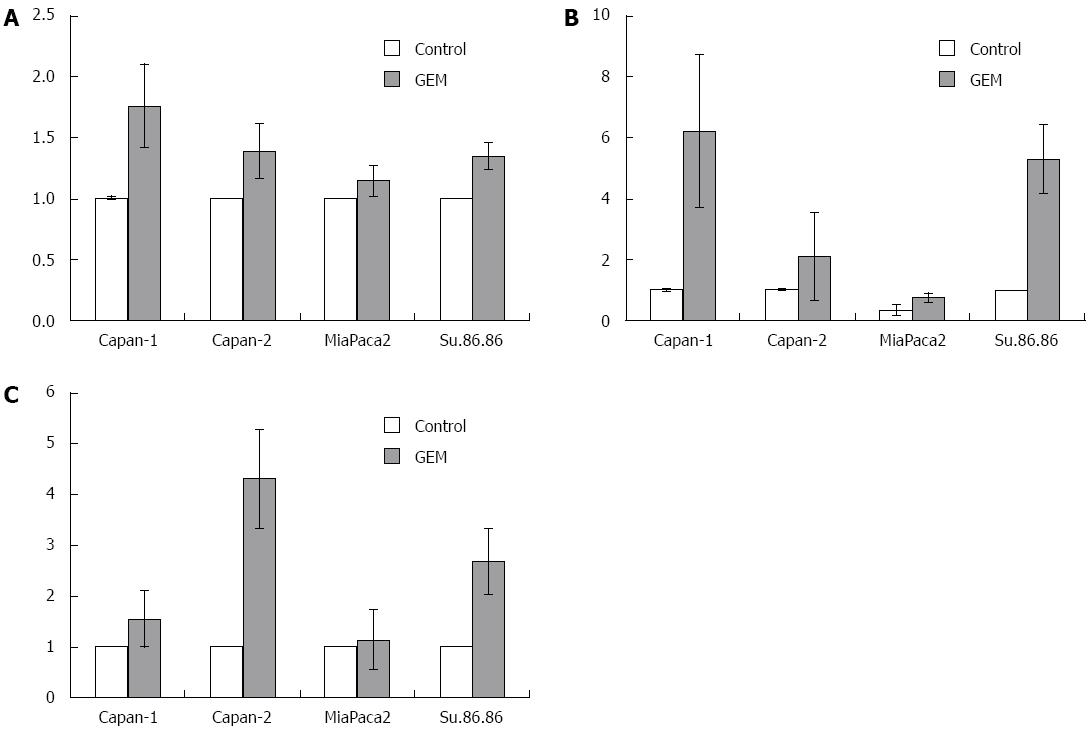
Figure 5 HuR, COX-2, and HO-1 mRNA expression in pancreatic cancer cells.
Quantitative reverse transcription polymerase chain reaction (qRT-PCR) analysis revealed higher normalized HuR (A), COX-2 (B), and HO-1 (C) mRNA values in GEM treated cells compared to control cells (P < 0.05). Data from three independent experiments are shown. For normalization β-actin housekeeping gene and ΔΔCt method was used. HO-1: Heme oxygenase-1; COX-2: Cyclooxygenase-2; HuR: Human antigen R.
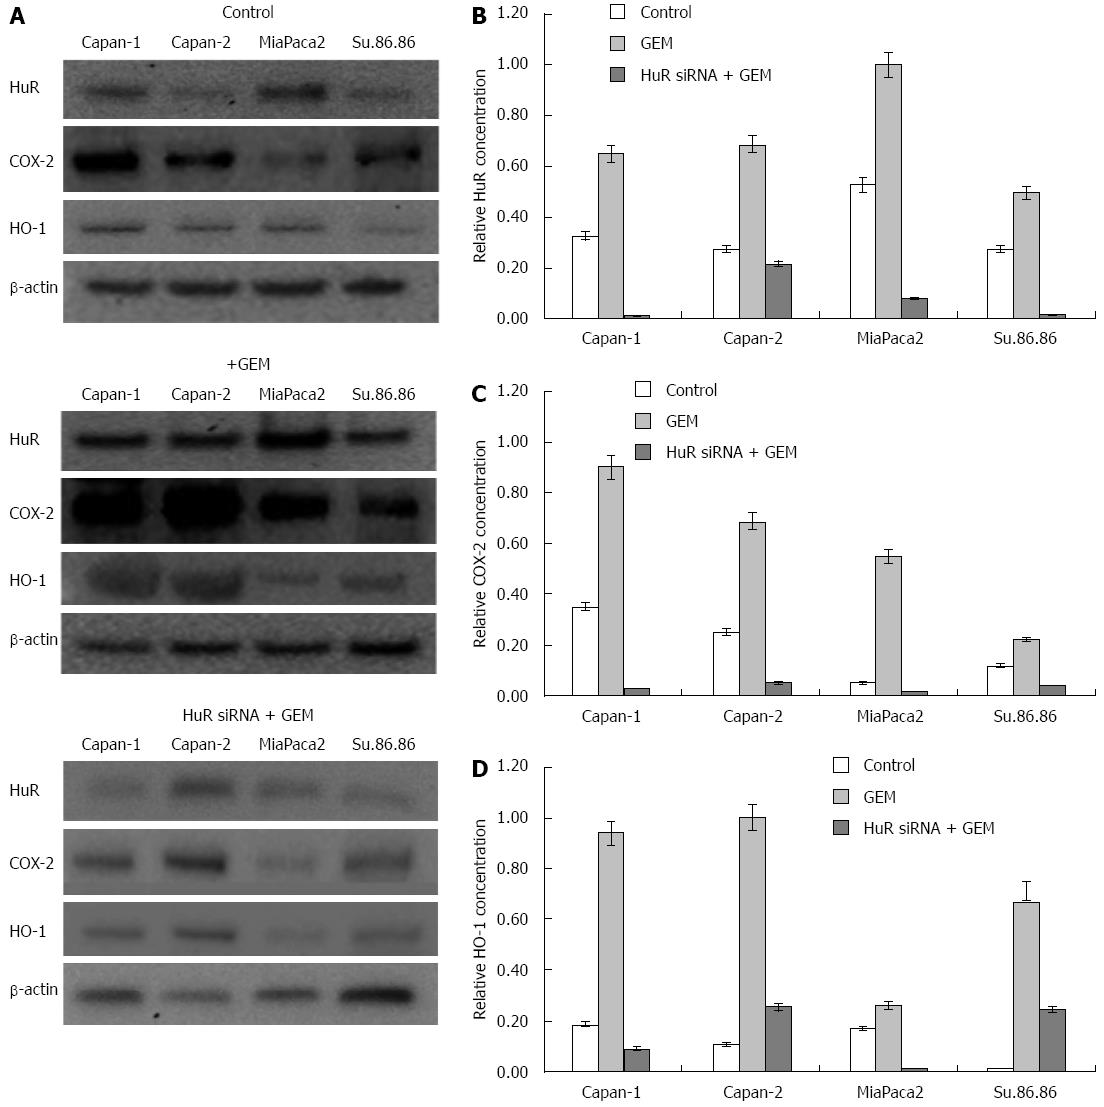
Figure 6 HuR, HO-1, and COX-2 protein expression analysis in pancreatic cancer cells.
The western blot analysis revealed differences in protein level between control cells and cells treated with gemcitabine (GEM) and cells treated with GEM after HuR silencing (A). The quantitative Western blot analysis revealed the relative concentration of COX-2 (B), HuR (C), and HO-1 (D) in each of the experimental groups. HO-1: Heme oxygenase-1; COX-2: Cyclooxygenase-2; HuR: Human antigen R.
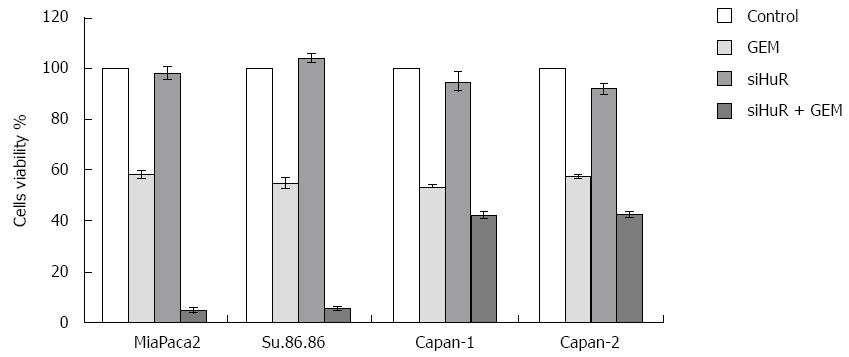
Figure 7 Cell viability analysis (MTT).
Viability was analyzed in control cells, cells treated with gemcitabine (GEM) IC50, siHUR alone, and GEM IC50 treatment after HuR siRNA. Transfection with HuR siRNA had little or no effect on cell viability, while HuR silencing dramatically increased response of pancreatic cancer cells to the GEM treatment. HuR: Human antigen R.
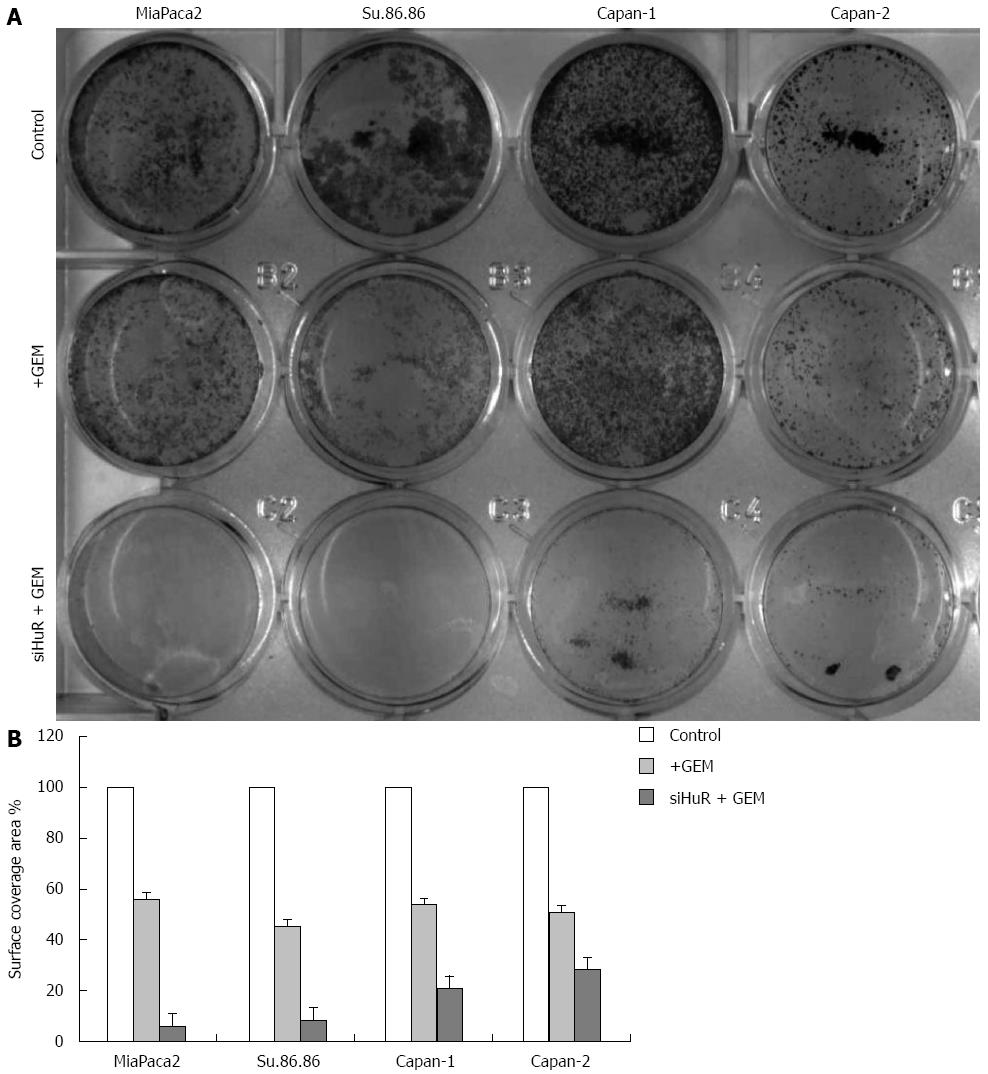
Figure 8 Colony formation of pancreatic cancer cells (crystal violet).
A: The colony formation (CV analysis) in 12-well plates; B: Quantitative CV analysis showed that cell surface coverage area was decreased in cells treated with GEM IC50 after HuR siRNA transfection compared with cells treated only with GEM IC50. HuR: Human antigen R; CV: Crystal violet.
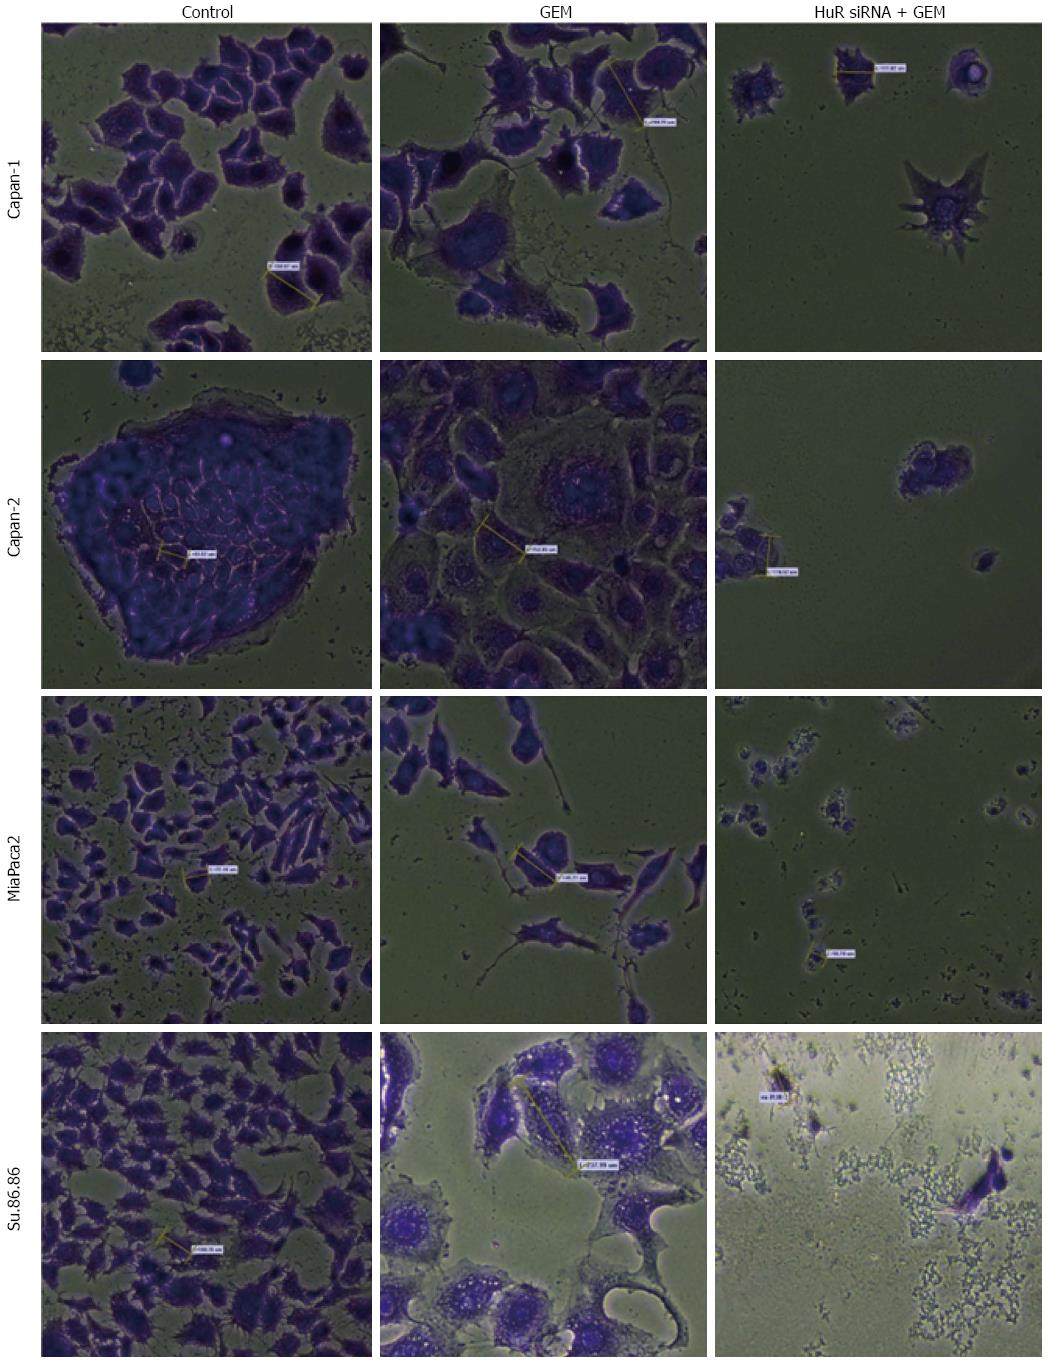
Figure 9 Morphological changes in the microscopic image of pancreatic cancer cells (magnification × 20).
Cells became enlarged after gemcitabine (GEM) treatment but became smaller, shapeless or spherical, and fragmented after combined HuR siRNA transfection and GEM treatment. HuR: Human antigen R. Average cell size is labeled by yellow dashes.
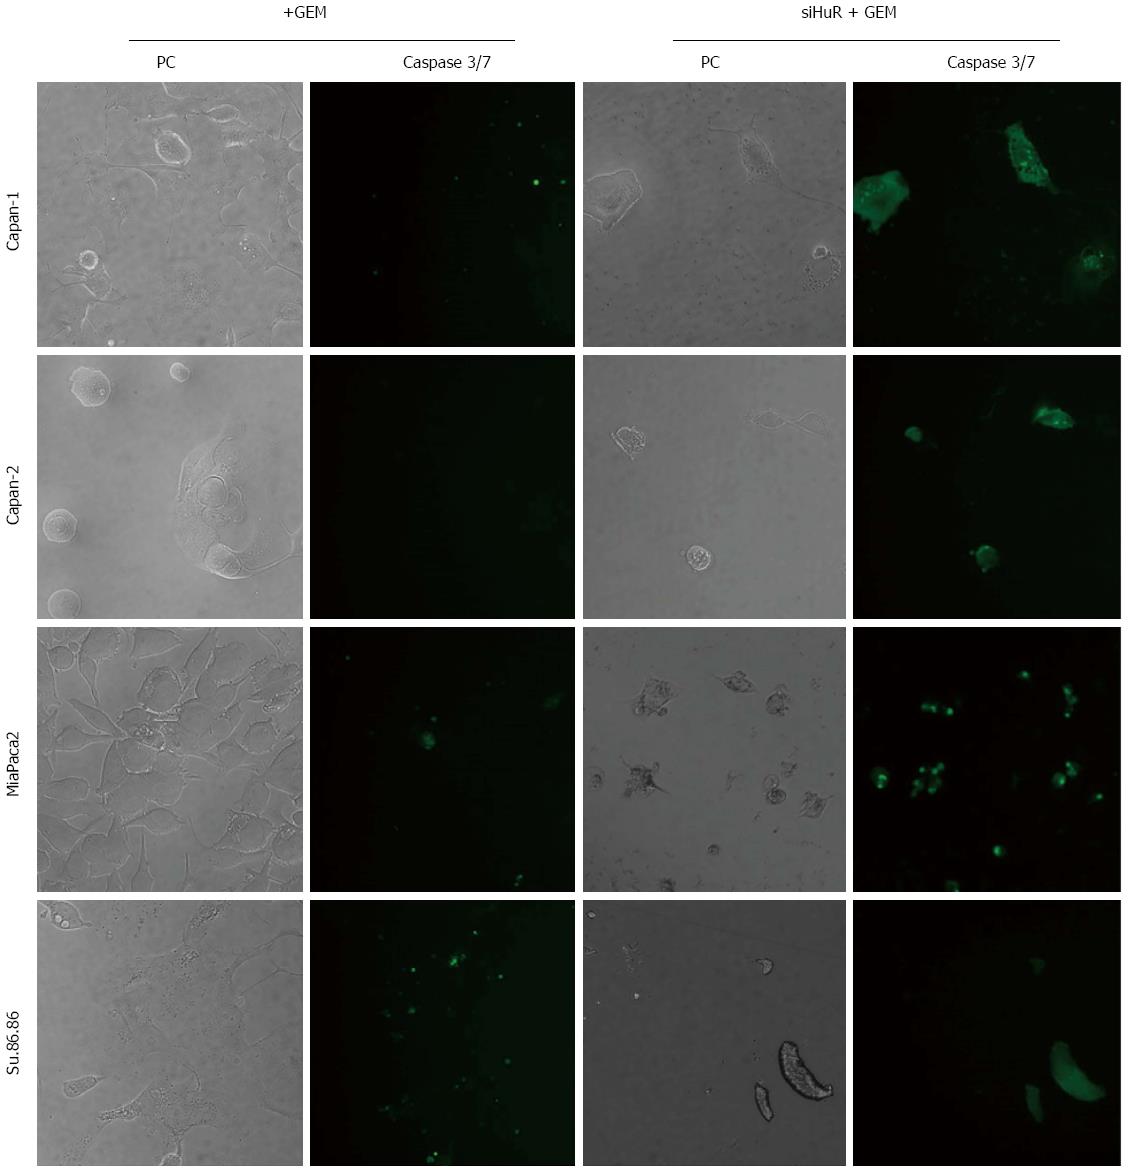
Figure 10 Analysis of caspases 3 and 7 activation in cells.
Caspases 3 and 7 were activated in all cell lines treated with GEM after HuR silencing but not after GEM alone treatment.
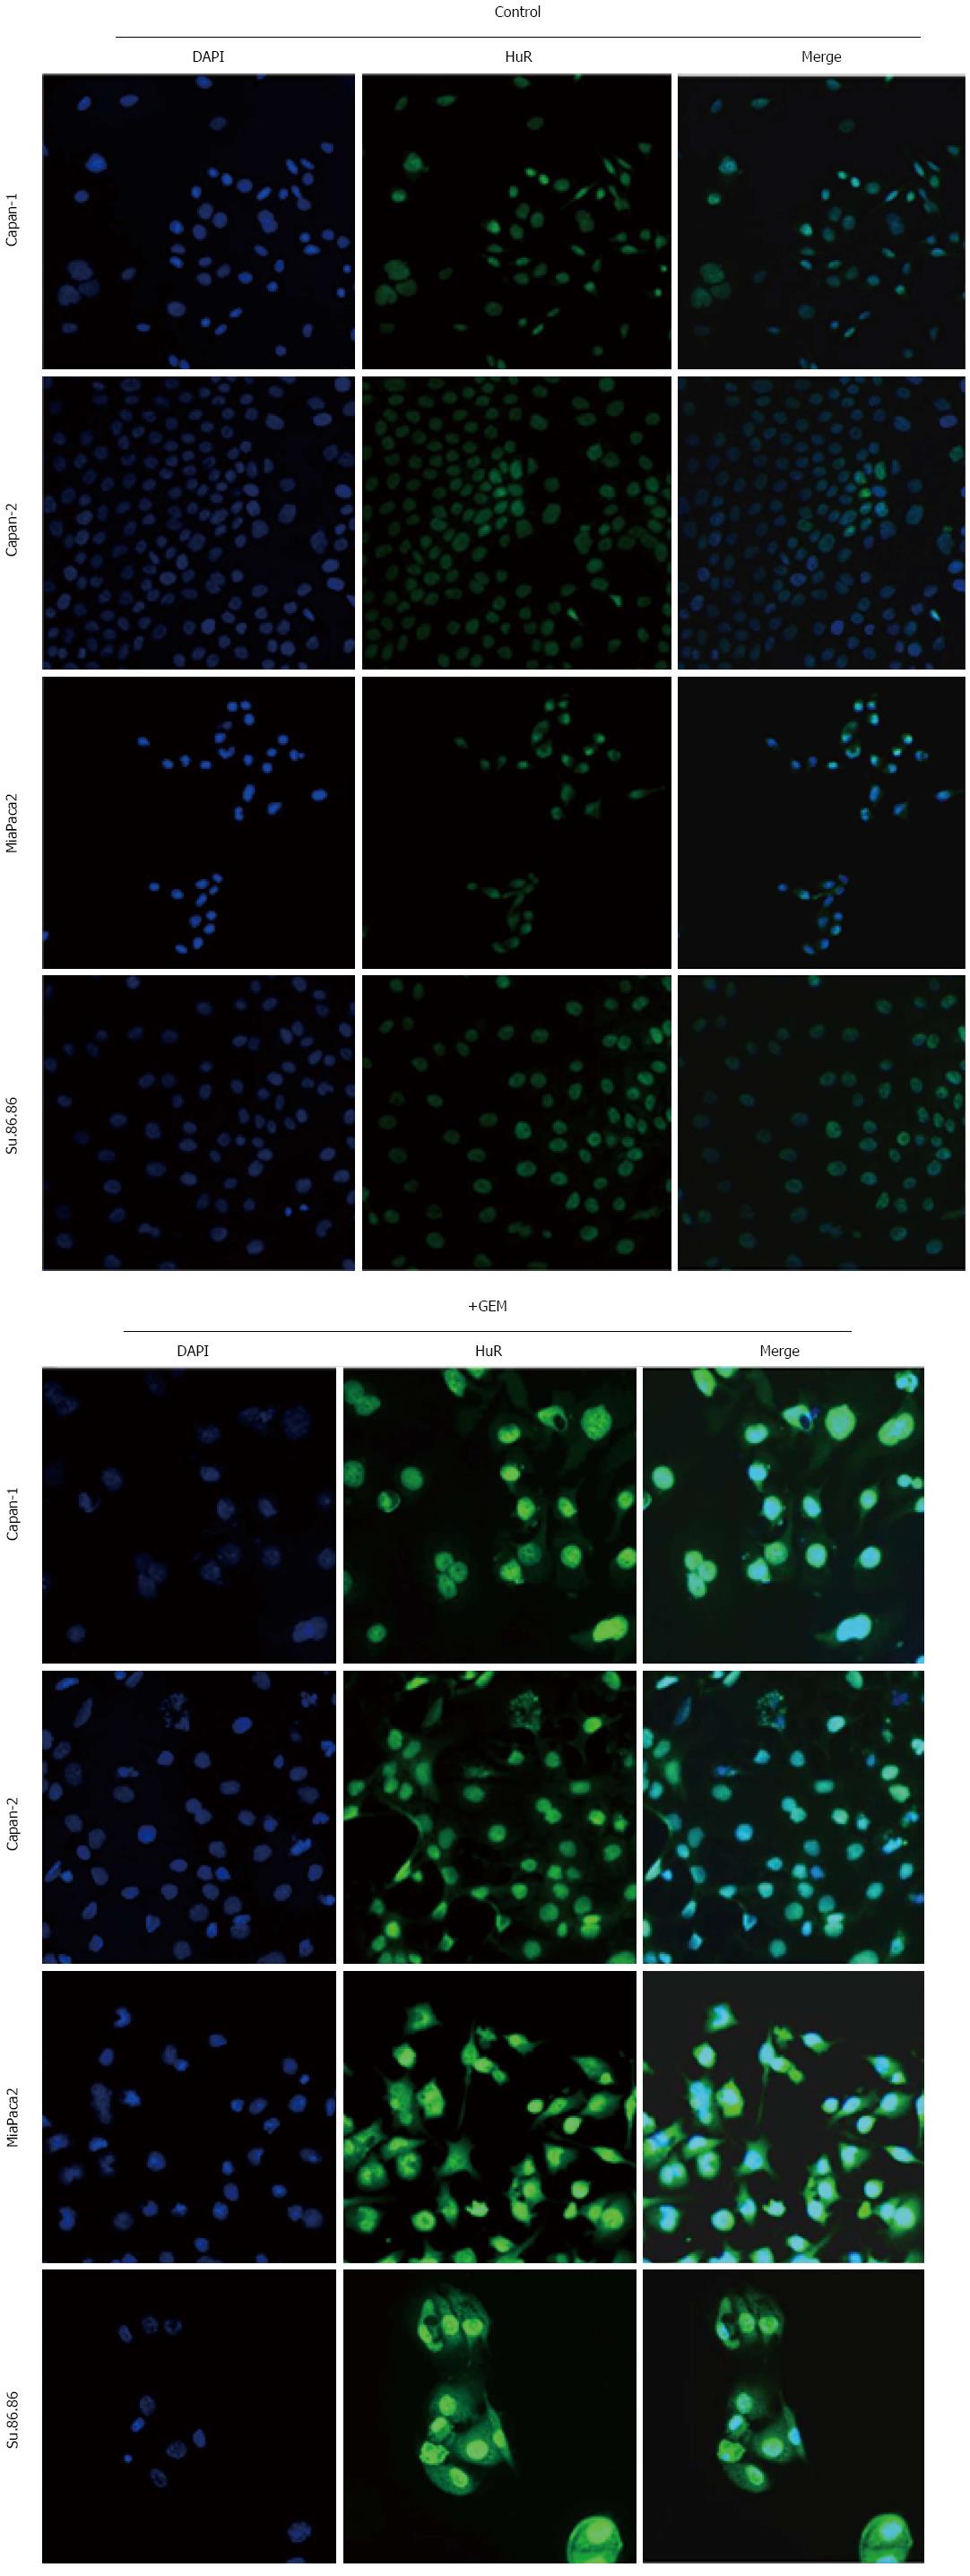
Figure 11 Immunofluorescence analysis of HuR protein expression.
Nuclear and cytoplasmic HuR expression was analyzed in control and treated with gemcitabine (GEM) cell lines. Shuttling of HuR from the nucleus to the cytoplasm was seen in cells after GEM treatment.
- Citation: Jakstaite A, Maziukiene A, Silkuniene G, Kmieliute K, Gulbinas A, Dambrauskas Z. HuR mediated post-transcriptional regulation as a new potential adjuvant therapeutic target in chemotherapy for pancreatic cancer. World J Gastroenterol 2015; 21(46): 13004-13019
- URL: https://www.wjgnet.com/1007-9327/full/v21/i46/13004.htm
- DOI: https://dx.doi.org/10.3748/wjg.v21.i46.13004


