Copyright
©The Author(s) 2015.
World J Gastroenterol. Nov 28, 2015; 21(44): 12605-12611
Published online Nov 28, 2015. doi: 10.3748/wjg.v21.i44.12605
Published online Nov 28, 2015. doi: 10.3748/wjg.v21.i44.12605
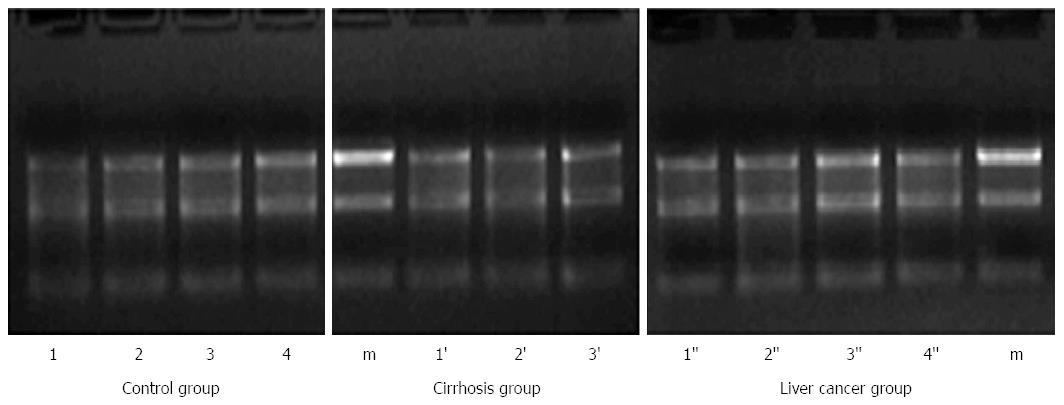
Figure 1 The result of electrophoresis of microRNA by 1.
2% agarose gel. m: RNA marker; Arabic numbers: Representative of the specimen’s number.
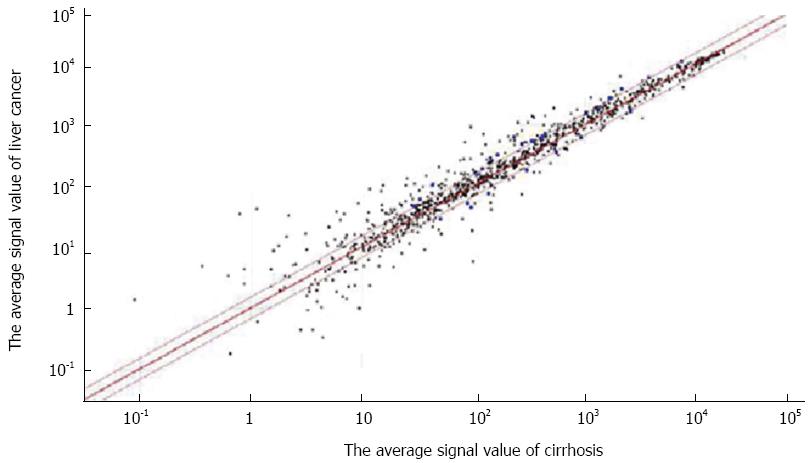
Figure 2 Scatter diagram of the calculation of microRNA expression by BeadArray reader software (Illumina).
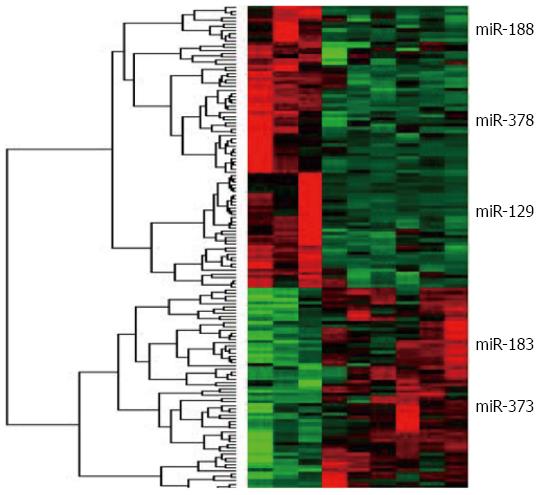
Figure 3 The results of the microRNA cluster analyzed.
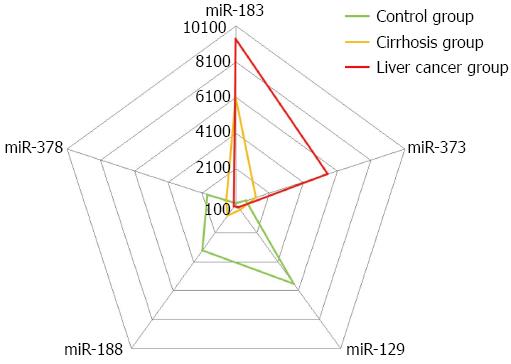
Figure 4 Radar chart showing the changes of each microRNA.
- Citation: Niu JX, Meng XK, Ren JJ. Studied microRNA gene expression in human hepatocellular carcinoma by microRNA microarray techniques. World J Gastroenterol 2015; 21(44): 12605-12611
- URL: https://www.wjgnet.com/1007-9327/full/v21/i44/12605.htm
- DOI: https://dx.doi.org/10.3748/wjg.v21.i44.12605


