Copyright
©The Author(s) 2015.
World J Gastroenterol. Nov 21, 2015; 21(43): 12505-12509
Published online Nov 21, 2015. doi: 10.3748/wjg.v21.i43.12505
Published online Nov 21, 2015. doi: 10.3748/wjg.v21.i43.12505
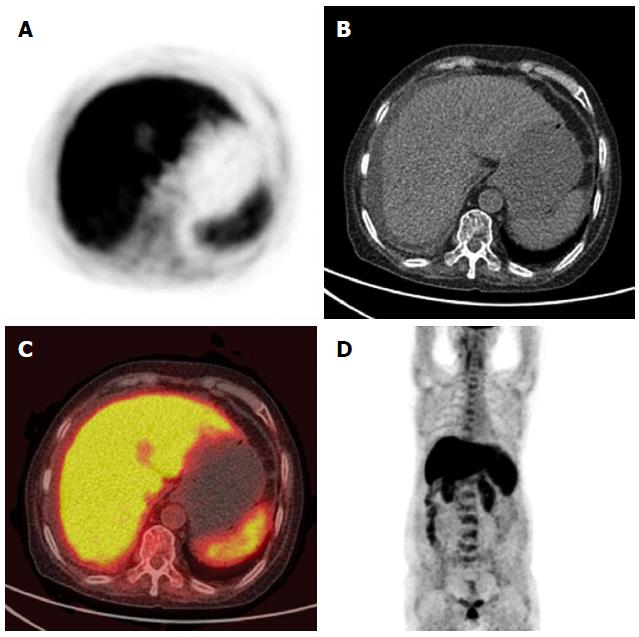
Figure 1 Findings on imaging.
PET (A), transverse CT (B), PET/CT fusion image (C) and maximum intensity projection (MIP, D) image of the whole body using fluorodeoxyglucose PET/CT (FDG PET/CT) demonstrate a large hypermetabolic deposit in the liver (standardized uptake value - SUVmax = 8.3 cm2/mL). PET: Positron emission tomography; CT: Computed tomography.
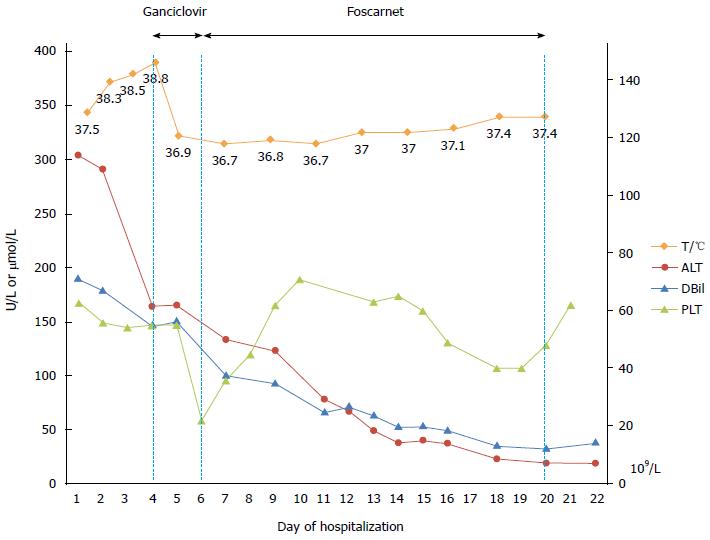
Figure 2 Biomedical profile during hospitalization.
The graph shows the changing pattern of body temperature (T), alanine aminotransferase (ALT), direct bilirubin (DBil) and platelet count (PLT) before and after antiviral therapy.
- Citation: Qian JY, Bai XY, Feng YL, Zhu WJ, Yao F, Li JN, Yang AM, Li F, Qian JM. Cholestasis, ascites and pancytopenia in an immunocompetent adult with severe cytomegalovirus hepatitis. World J Gastroenterol 2015; 21(43): 12505-12509
- URL: https://www.wjgnet.com/1007-9327/full/v21/i43/12505.htm
- DOI: https://dx.doi.org/10.3748/wjg.v21.i43.12505


