Copyright
©The Author(s) 2015.
World J Gastroenterol. Jan 28, 2015; 21(4): 1344-1348
Published online Jan 28, 2015. doi: 10.3748/wjg.v21.i4.1344
Published online Jan 28, 2015. doi: 10.3748/wjg.v21.i4.1344
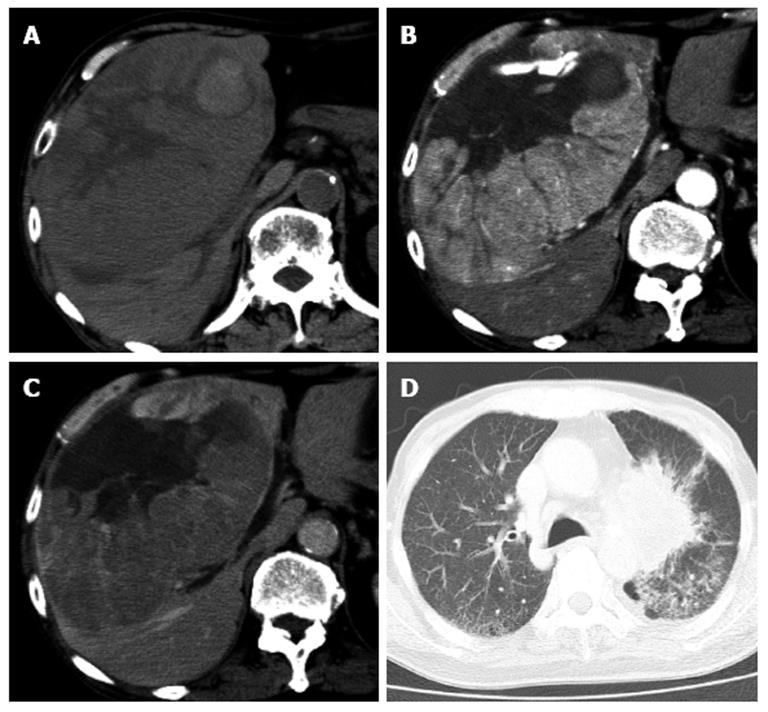
Figure 1 Contrast enhanced computed tomography image of the abdomen shows a huge tumor that occupies the right hepatic lobe, with enhancement in a viable lesion.
A: Non-contrast phase; B: Hepatic arterial phase; C: Portal vein phase; D: Computed tomography image of the chest shows a primary lung cancer in the hilar side of the left lung.
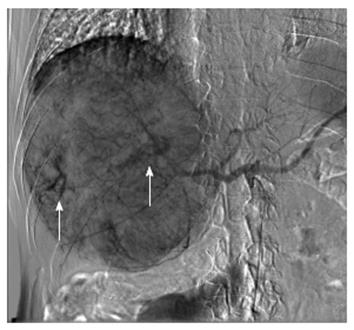
Figure 2 Hepatic arteriography shows arteriovenous shunting from hepatic arteries to hepatic veins (arrows).
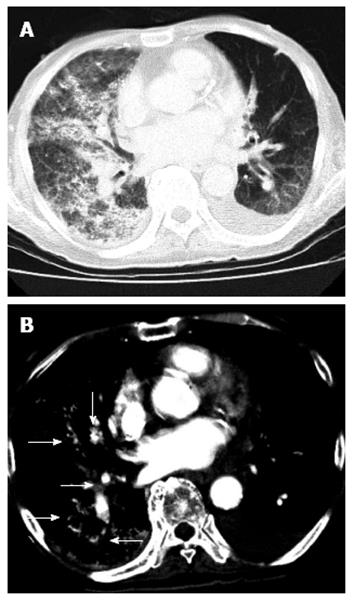
Figure 3 Computed tomography image.
A: The chest 2 h after transarterial chemoembolization demonstrates diffuse increased attenuation and interstitial thickening; B: There is also an accumulation of lipiodol (arrows), particularly in the right lung lobe.
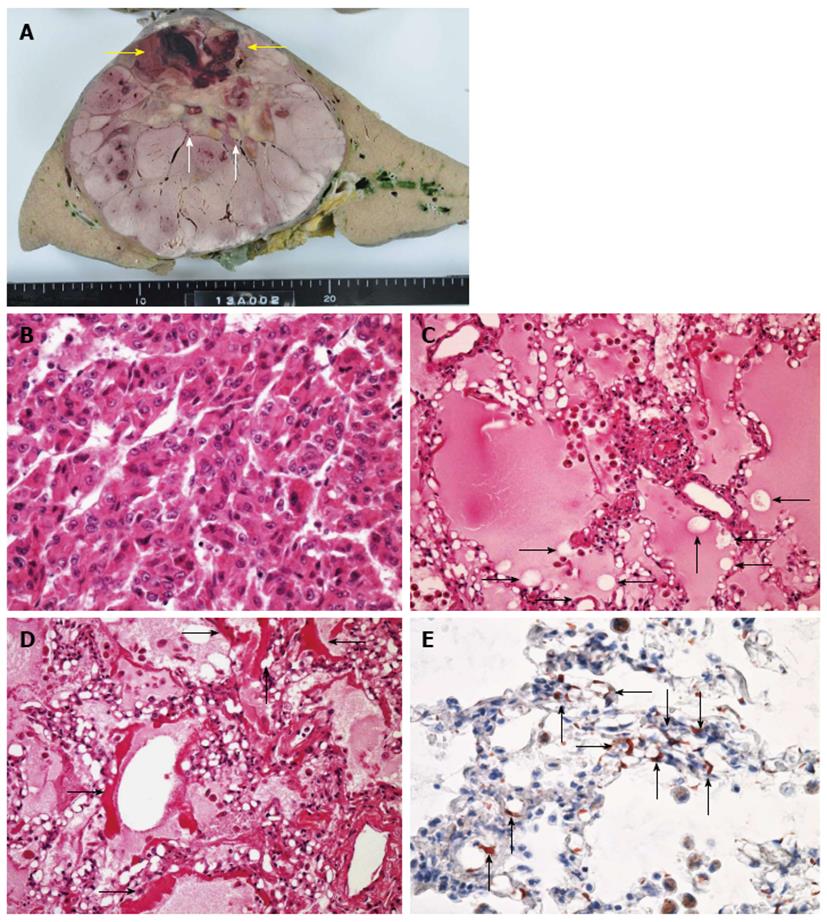
Figure 4 Histopathological findings.
A: Macrograph of the liver shows a huge 16 cm × 16 cm tumor with necrotic changes (white arrows) and hemorrhage (yellow arrows); B: Micrograph of the liver tumor [hematoxylin and eosin (H and E) staining] shows moderately differentiated hepatocellular carcinoma with thin and thick mixed trabeculae. The background of the liver was normal (not shown); C: Micrograph of the lung (H and E staining) reveals alveolar edema and hemorrhage with fat droplet depositions (arrows); D: Fibrin thrombi (arrows); E: Fat specific staining with Sudan III indicates the presence of fat droplets in the pulmonary arteriolar lumen (arrows).
- Citation: Hatamaru K, Azuma S, Akamatsu T, Seta T, Urai S, Uenoyama Y, Yamashita Y, Ono K. Pulmonary embolism after arterial chemoembolization for hepatocellular carcinoma: An autopsy case report. World J Gastroenterol 2015; 21(4): 1344-1348
- URL: https://www.wjgnet.com/1007-9327/full/v21/i4/1344.htm
- DOI: https://dx.doi.org/10.3748/wjg.v21.i4.1344


