Copyright
©The Author(s) 2015.
World J Gastroenterol. Jan 28, 2015; 21(4): 1275-1283
Published online Jan 28, 2015. doi: 10.3748/wjg.v21.i4.1275
Published online Jan 28, 2015. doi: 10.3748/wjg.v21.i4.1275
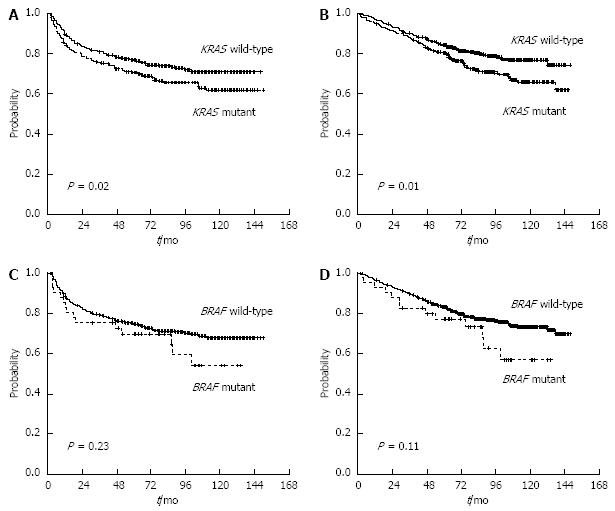
Figure 1 Kaplan-Meier curves for disease-free survival and overall survival according to KRAS or BRAF status.
A: Disease-free survival (DFS) according to KRAS status; B: Overall survival (OS) according to KRAS status; C: DFS according to BRAF status; D: OS according to BRAF status.
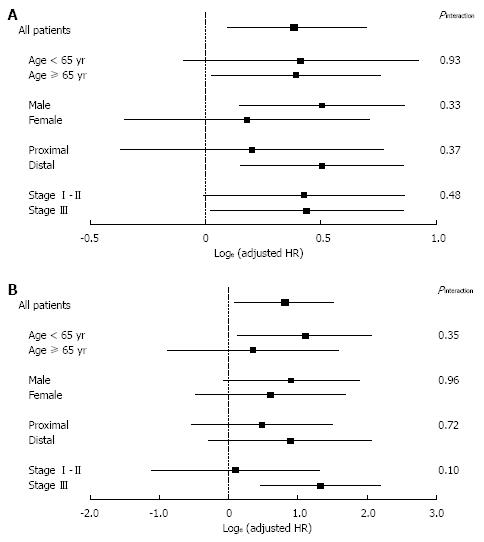
Figure 2 Stratified analysis of KRAS or BRAF status and overall survival.
Loge [adjusted hazard ratio (HR)] and 95%CI for BRAF and KRAS mutant tumors (vs wild-type tumors) in various strata are shown. A: KRAS mutant tumors; B: BRAF mutant tumors.
-
Citation: Kadowaki S, Kakuta M, Takahashi S, Takahashi A, Arai Y, Nishimura Y, Yatsuoka T, Ooki A, Yamaguchi K, Matsuo K, Muro K, Akagi K. Prognostic value of
KRAS andBRAF mutations in curatively resected colorectal cancer. World J Gastroenterol 2015; 21(4): 1275-1283 - URL: https://www.wjgnet.com/1007-9327/full/v21/i4/1275.htm
- DOI: https://dx.doi.org/10.3748/wjg.v21.i4.1275


