Copyright
©The Author(s) 2015.
World J Gastroenterol. Jan 28, 2015; 21(4): 1234-1242
Published online Jan 28, 2015. doi: 10.3748/wjg.v21.i4.1234
Published online Jan 28, 2015. doi: 10.3748/wjg.v21.i4.1234
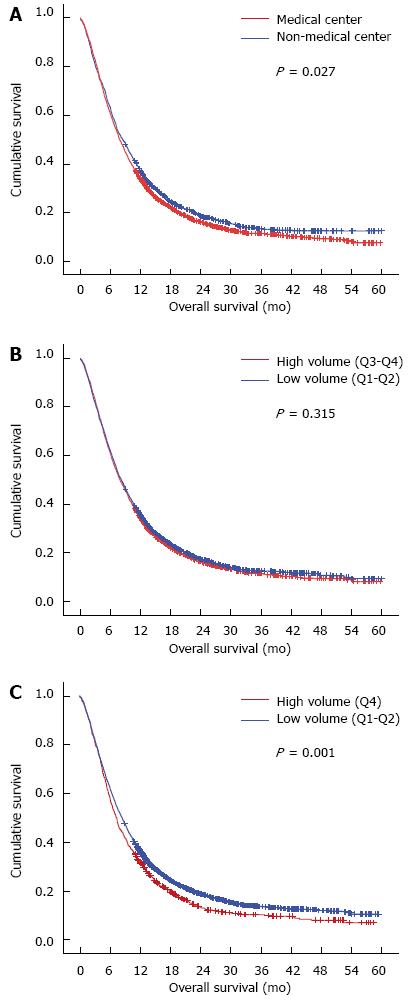
Figure 1 Kaplan-Meier plot.
A: Showing that the overall survival was better in the non-medical centers (blue line) compared with the medical centers (red line) (P = 0.027, non-medical centers vs medical centers ); B: Showing that no overall survival difference was noted between the hospitals in Q3-4 (red line) and Q1-2 (blue line) (P = 0.315, Q3-4 vs Q1-2); C: Showing that the overall survival was better in the low-volume hospitals (Q1-3, blue line) compared with the very high-volume hospitals [Q4, red line (P = 0.001), low volume hospitals vs high volume hospitals].
- Citation: Hsu PK, Chen HS, Wang BY, Wu SC, Liu CY, Shih CH, Liu CC. Hospital type- and volume-outcome relationships in esophageal cancer patients receiving non-surgical treatments. World J Gastroenterol 2015; 21(4): 1234-1242
- URL: https://www.wjgnet.com/1007-9327/full/v21/i4/1234.htm
- DOI: https://dx.doi.org/10.3748/wjg.v21.i4.1234


