Copyright
©The Author(s) 2015.
World J Gastroenterol. Oct 14, 2015; 21(38): 10926-10930
Published online Oct 14, 2015. doi: 10.3748/wjg.v21.i38.10926
Published online Oct 14, 2015. doi: 10.3748/wjg.v21.i38.10926
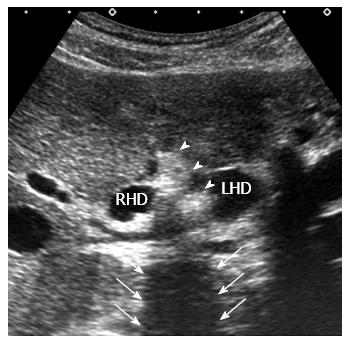
Figure 1 Finding of ultrasonography.
Transverse ultrasonography shows a highly echogenic mass (arrow head) with posterior acoustic shadowing (arrow) at the confluence of the right and left hepatic duct. RHD: Right hepatic duct; LHD: Left hepatic duct.
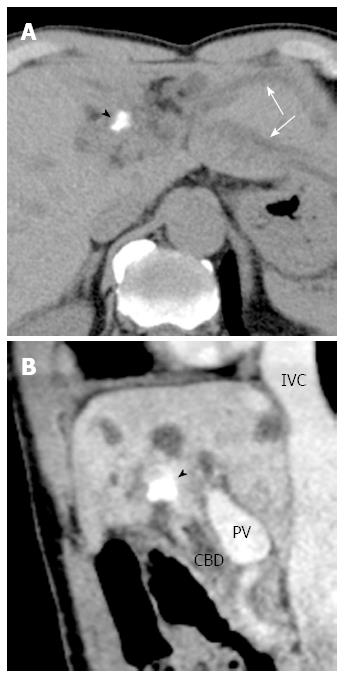
Figure 2 Findings of computed tomography.
A: Plain transverse computed tomography (CT) reveals a high-density area at the liver hilus (arrow head) with dilated left intrahepatic bile ducts (arrows); B: Sagittal plane of enhanced CT shows the perihilar high-density area (arrow head). PV: Portal vein; IVC: Inferior vena cava; CBD: Common bile duct.
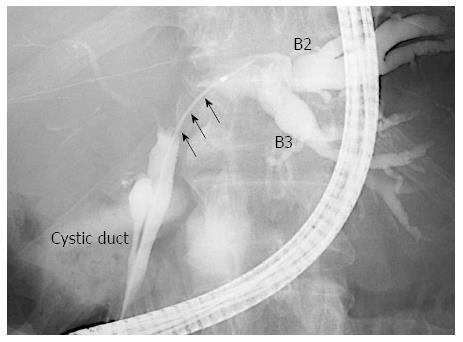
Figure 3 Finding of endoscopic retrograde cholangiography.
Cholangiography via the trans-papillary route shows marked biliary stricture and disruption at the left hepatic duct (arrows), but no defect area.
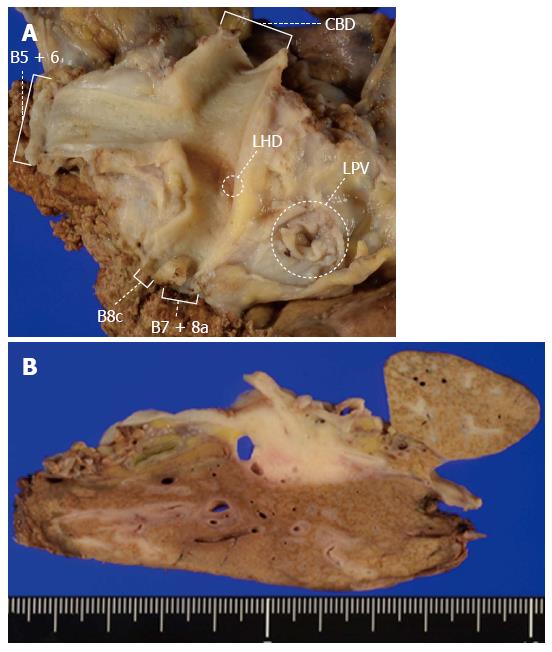
Figure 4 Macroscopic findings.
A: Opened bile duct of the resected specimen. The left hepatic duct is highly obstructed; B: Gross appearance of the cut surface of the resected liver shows a gray-white tumor measuring 28 mm × 21 mm in the hepatic hilum to the left hepatic duct, while no stones are found in the hepatic hilum. CBD: Common bile duct; LHD: Left hepatic duct; LPV: Left portal vein.
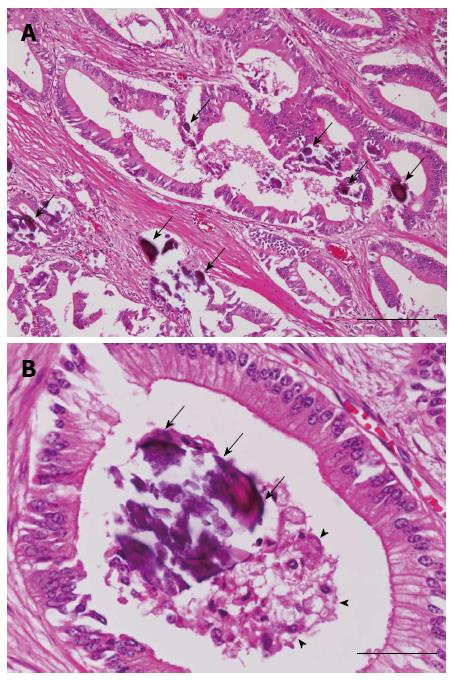
Figure 5 Histopathological findings (hematoxylin and eosin staining).
A: Microscopic examination reveals a mucus-secreting, gastric foveolar type adenocarcinoma with numerous fine calcifications (arrows) (bar = 200 μm); B: The calcified material (arrows) is located in the mucus (arrow head) in the tumor glands (bar = 50 μm).
- Citation: Inoko K, Tsuchikawa T, Noji T, Kurashima Y, Ebihara Y, Tamoto E, Nakamura T, Murakami S, Okamura K, Shichinohe T, Hirano S. Hilar cholangiocarcinoma with intratumoral calcification: A case report. World J Gastroenterol 2015; 21(38): 10926-10930
- URL: https://www.wjgnet.com/1007-9327/full/v21/i38/10926.htm
- DOI: https://dx.doi.org/10.3748/wjg.v21.i38.10926


