Copyright
©The Author(s) 2015.
World J Gastroenterol. Oct 7, 2015; 21(37): 10675-10682
Published online Oct 7, 2015. doi: 10.3748/wjg.v21.i37.10675
Published online Oct 7, 2015. doi: 10.3748/wjg.v21.i37.10675
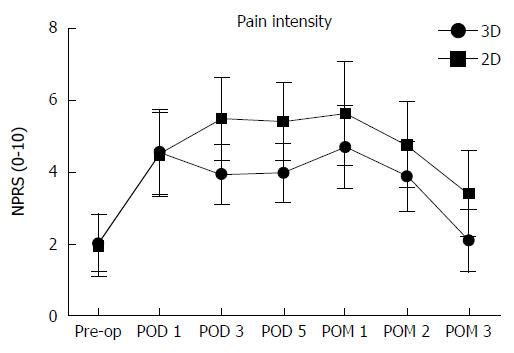
Figure 1 Pain intensity.
The pain intensity of the patients undergoing the three-dimensional video-assisted thoracoscopic esophagectomy (3D-VATE) and two-dimensional (2D)-VATE was showed via the numerical pain rating scale (NPRS). The pain degree of the patients on postoperative PODs 3, 5 and POMs 1, 2 and 3 indicated a statistically significant difference between the 3D group and the 2D group (P < 0.05). 3D vs 2D, POD 3: 3.93 ± 0.84 vs 5.48 ± 1.15, P = 0.002; POD 5: 3.96 ± 0.82 vs 5.40 ± 1.01, P = 0.01; POM 1: 4.69 ± 1.15 vs 5.63 ± 1.44, P = 0.048; POM 2: 3.87 ± 0.94 vs 4.75 ± 1.2, P = 0.029; POM 3: 2.07 ± 0.863 vs 3.38 ± 1.20, P = 0.007. pre-op: Preoperation; POD: Postoperative day; POM: Postoperative month.
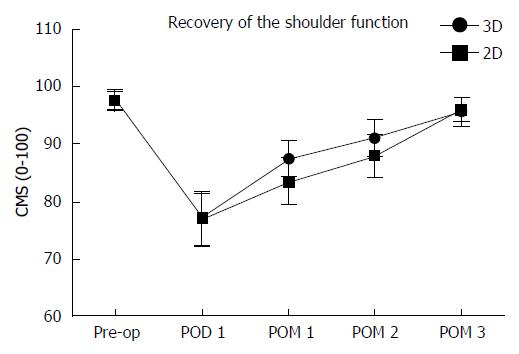
Figure 2 Recovery of the shoulder function.
The shoulder recovery condition had a statistically significant difference between the two groups on POM 1 (3D vs 2D, POM 1:87.40 ± 3.14 vs 83.50 ± 4.05, P = 0.03). CMS: Constant-Murley scale; pre-op: Pre-operation; POD: Postoperative day; POM: Postoperative month; 3D: Three-dimensional; 2D: Two-dimensional.
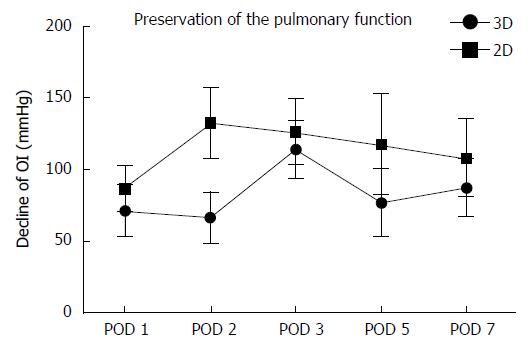
Figure 3 Preservation of the pulmonary function.
Decline of the OI on PODs 1, 2, 3, 5 and 7 was significantly smaller in the 3D group compared to that in the 2D group (POD 1: 71.01 ± 17.92 mmHg vs 86.25 ± 15.91 mmHg; POD 2: 66.71 ± 17.58 mmHg vs 132.22 ± 25.04 mmHg; POD 3: 113.69 ± 20.25 mmHg vs 126.14 ± 22.96 mmHg; POD 5: 76.79 ± 23.52 mmHg vs 117.25 ± 34.88 mmHg; POD 7: 87.26 ± 19.88 mmHg vs 107.83 ± 27.11 mmHg, P < 0.01). OI: Oxygenation index; POD: Postoperative day; 3D: Three-dimensional; 2D: Two-dimensional.
-
Citation: Li Z, Li JP, Qin X, Xu BB, Han YD, Liu SD, Zhu WZ, Peng MZ, Lin Q. Three-dimensional
vs two-dimensional video assisted thoracoscopic esophagectomy for patients with esophageal cancer. World J Gastroenterol 2015; 21(37): 10675-10682 - URL: https://www.wjgnet.com/1007-9327/full/v21/i37/10675.htm
- DOI: https://dx.doi.org/10.3748/wjg.v21.i37.10675


