Copyright
©The Author(s) 2015.
World J Gastroenterol. Sep 14, 2015; 21(34): 9916-9926
Published online Sep 14, 2015. doi: 10.3748/wjg.v21.i34.9916
Published online Sep 14, 2015. doi: 10.3748/wjg.v21.i34.9916
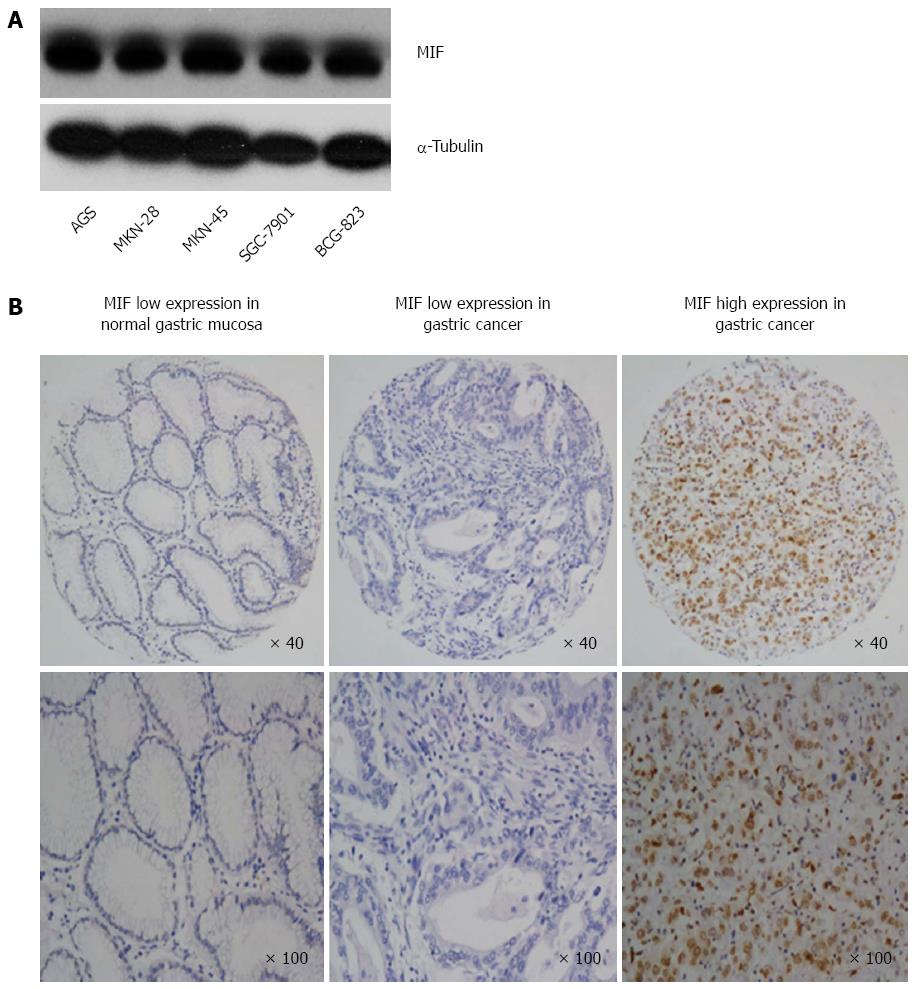
Figure 1 Macrophage migration inhibitory factor protein expression levels in gastric cancer cell lines and tissues.
A: Macrophage migration inhibitory factor (MIF) protein expression was increased in five gastric cancer cell lines compared with that of α-tubulin (control). Results are representative of three independent experiments; B: Expression of MIF protein in normal and gastric cancer tissue samples. Magnification in the three top panels is × 40 and is × 100 in the bottom three panels. Survival was assessed by Kaplan-Meier analysis and differences were calculated with the log rank test.
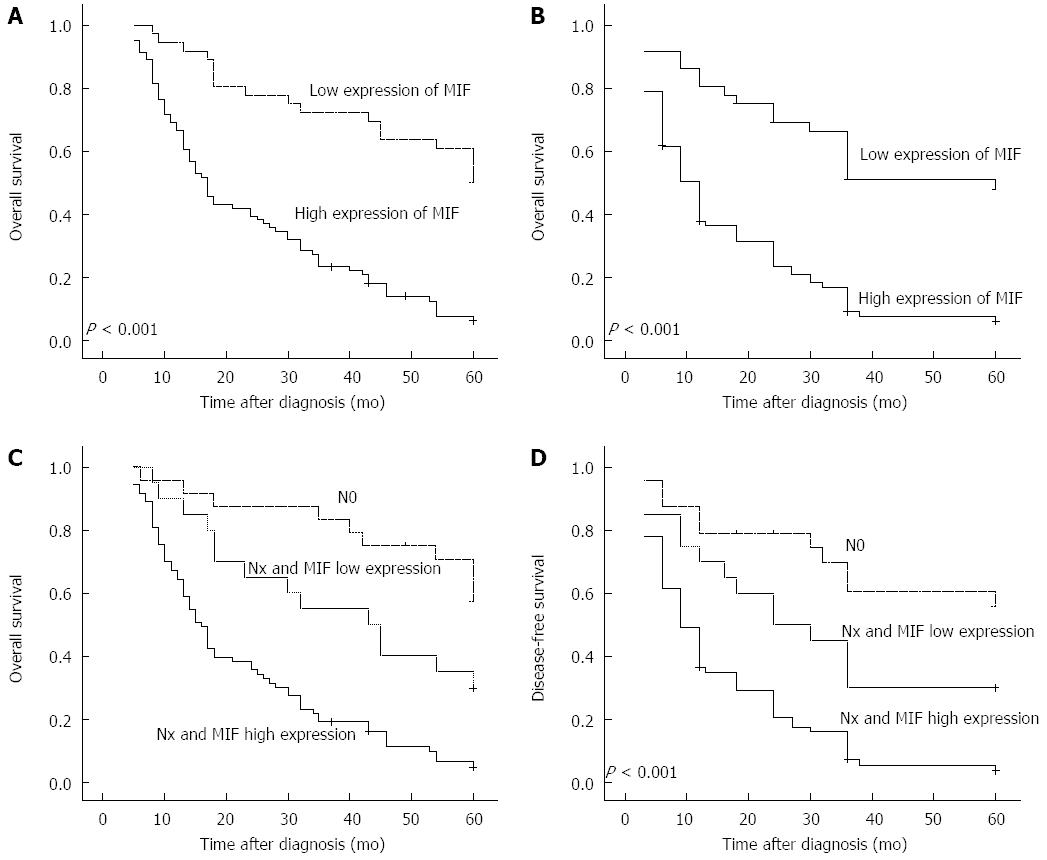
Figure 2 Macrophage migration inhibitory factor protein expression levels in gastric cancer tissue and association with overall and disease-free patient survival rates.
A, B: Overall (A) and disease-free (B) survival in patients with gastric cancer who had low expression levels of macrophage migration inhibitory factor (MIF) (n = 36) vs high expression (n = 81); C, D: Overall survival (C) and disease-free (D) survival in patients with gastric cancer lymph-node metastasis who had low expression levels of MIF (n = 20) vs those with a high expression levels of MIF (n = 73) and in those without lymphatic metastasis (n = 24).
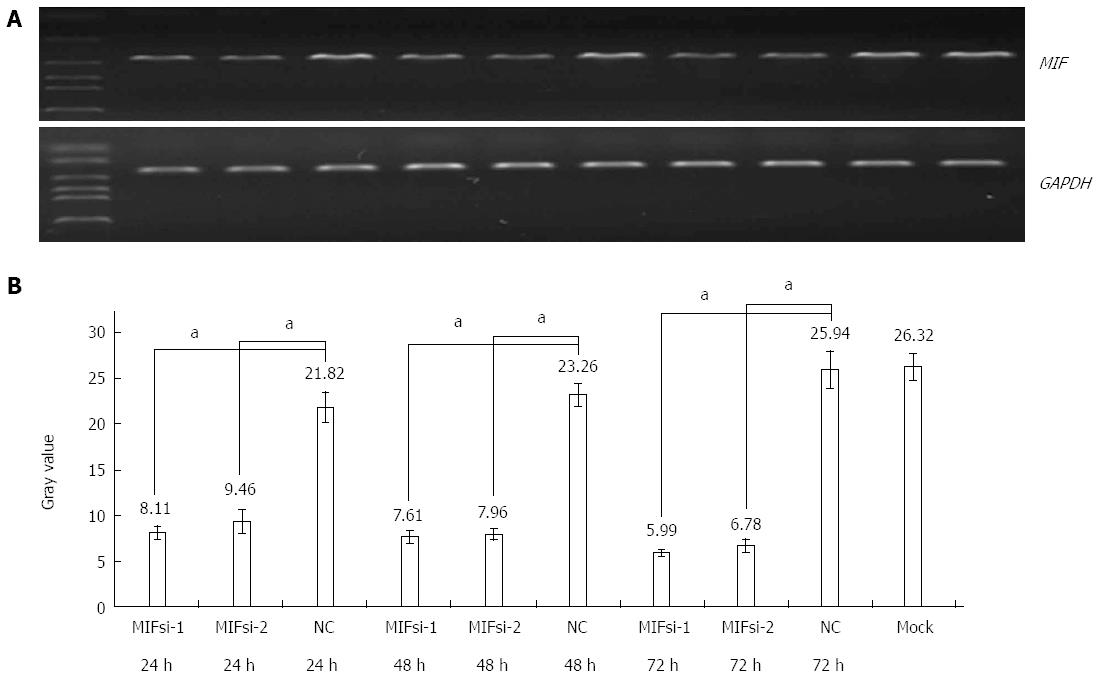
Figure 3 Macrophage migration inhibitory factor mRNA expression in AGS cells.
A: Electrophoresis with 2% agarose gel and real-time polymerase chain reaction analysis show substantially reduced macrophage migration inhibitory factor (MIF) mRNA levels compared with the GAPDH internal control; B: Gray values in AGS cells transfected with MIF small-interfering RNA pairs (si-1 or si-2) or scrambled small-interfering RNA (negative control). Results are representative of three independent experiments for each AGS and MKN-45 cells. NC: Negative control.
Figure 4 Macrophage migration inhibitory factor protein expression in AGS cells after 24 h of RNA interference.
A: Western blot analysis showed that macrophage migration inhibitory factor protein expression was decreased at 24 h after transfection of cells with small-interfering RNA, compared with α-tubulin control (aP < 0.001); B: Corresponding gray values. Results are representative of three independent experiments for each AGS and MKN-45 cells. NC: Negative control.
Figure 5 Macrophage migration inhibitory factor protein expression in AGS cells after 48 h of RNA interference.
A: Western blot analysis showed that macrophage migration inhibitory factor (MIF) protein expression was decreased at 48 h after transfection of cells with small-interfering RNA, compared with α-tubulin control (aP < 0.001); B: Corresponding gray values. Results are representative of three independent experiments for each AGS and MKN-45 cells. NC: Negative control.
Figure 6 Macrophage migration inhibitory factor protein expression in AGS cells after 72 h of RNA interference.
A: Western blot analysis showed that macrophage migration inhibitory factor (MIF) protein expression was decreased at 72 h after transfection of cells with small-interfering RNA, compared with α-tubulin control (P < 0.001); B: Corresponding gray values. Results are representative of three independent experiments for each AGS and MKN-45 cells. NC: Negative control.
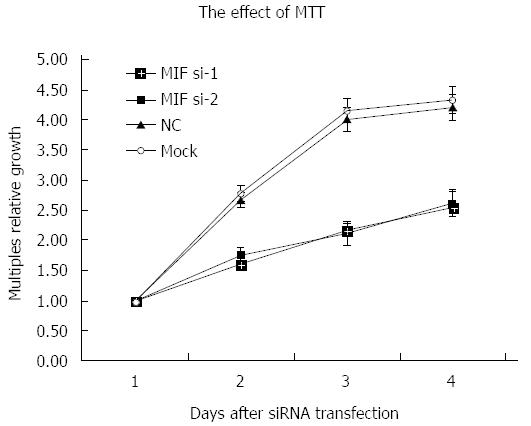
Figure 7 Effect of macrophage migration inhibitory factor silencing on AGS cell proliferation.
Results are representatives of mean ± SD for three independent experiments for each AGS and MKN-45 cells. MTT: 3-(4,5-dimethylthiazol-2-yl)-2,5-diphenyltetrazolium bromide; NC: Negative control; siRNA: Small-interfering RNA.
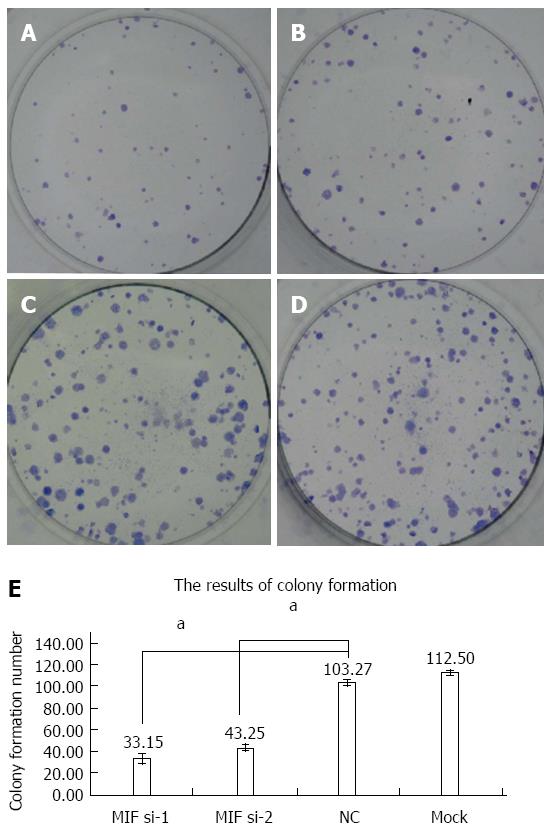
Figure 8 Colony formation of AGS cells in each group in clone plating assay.
A: Macrophage migration inhibitory factor (MIF) si-1 group; B: MIF si-2 group; C: Negative control group; D: Mock group; E: Histogram showing numbers of clones. Results are representative of three independent experiments for each AGS and MKN-45 cells. NC: Negative control.
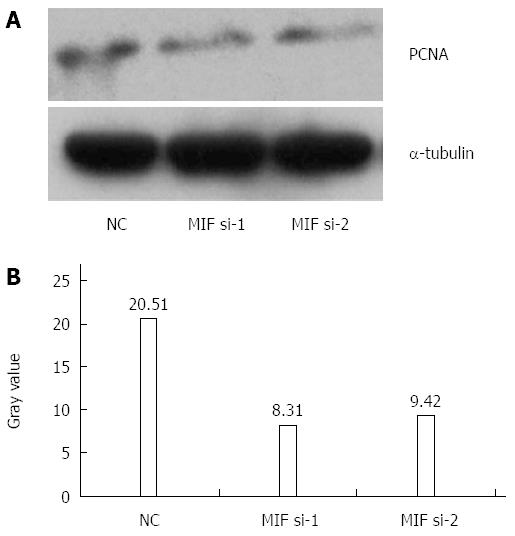
Figure 9 Proliferating cell nuclear antigen protein expression in AGS cells after 72 h of RNA interference with small-interfering RNA.
A: Western blot analysis showed that PCNA protein expression was substantially reduced compared with that of the α-tubulin control (P < 0.001); B: Corresponding gray values. Results are representative of three independent experiments for each AGS and MKN-45 cells. NC: Negative control; PCNA: Proliferating cell nuclear antigen.
- Citation: He LJ, Xie D, Hu PJ, Liao YJ, Deng HX, Kung HF, Zhu SL. Macrophage migration inhibitory factor as a potential prognostic factor in gastric cancer. World J Gastroenterol 2015; 21(34): 9916-9926
- URL: https://www.wjgnet.com/1007-9327/full/v21/i34/9916.htm
- DOI: https://dx.doi.org/10.3748/wjg.v21.i34.9916


