Copyright
©The Author(s) 2015.
World J Gastroenterol. Sep 14, 2015; 21(34): 9916-9926
Published online Sep 14, 2015. doi: 10.3748/wjg.v21.i34.9916
Published online Sep 14, 2015. doi: 10.3748/wjg.v21.i34.9916
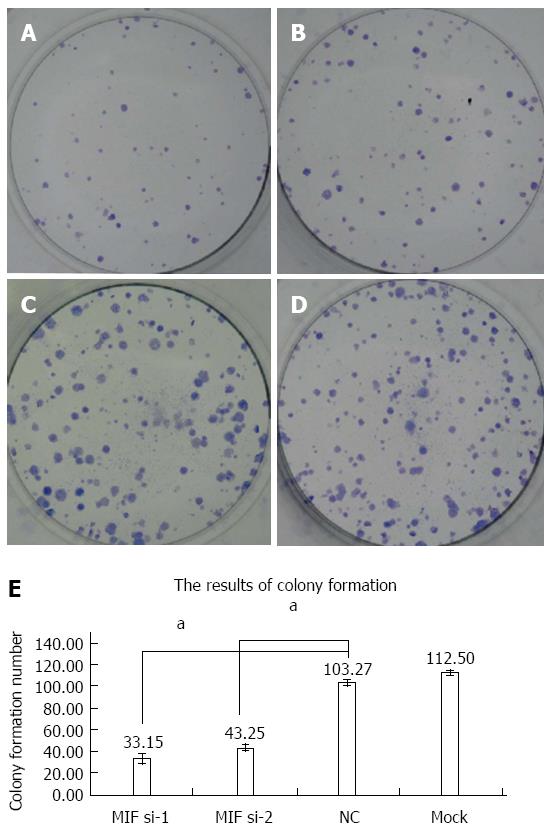
Figure 8 Colony formation of AGS cells in each group in clone plating assay.
A: Macrophage migration inhibitory factor (MIF) si-1 group; B: MIF si-2 group; C: Negative control group; D: Mock group; E: Histogram showing numbers of clones. Results are representative of three independent experiments for each AGS and MKN-45 cells. NC: Negative control.
- Citation: He LJ, Xie D, Hu PJ, Liao YJ, Deng HX, Kung HF, Zhu SL. Macrophage migration inhibitory factor as a potential prognostic factor in gastric cancer. World J Gastroenterol 2015; 21(34): 9916-9926
- URL: https://www.wjgnet.com/1007-9327/full/v21/i34/9916.htm
- DOI: https://dx.doi.org/10.3748/wjg.v21.i34.9916


