Copyright
©The Author(s) 2015.
World J Gastroenterol. Aug 28, 2015; 21(32): 9598-9606
Published online Aug 28, 2015. doi: 10.3748/wjg.v21.i32.9598
Published online Aug 28, 2015. doi: 10.3748/wjg.v21.i32.9598
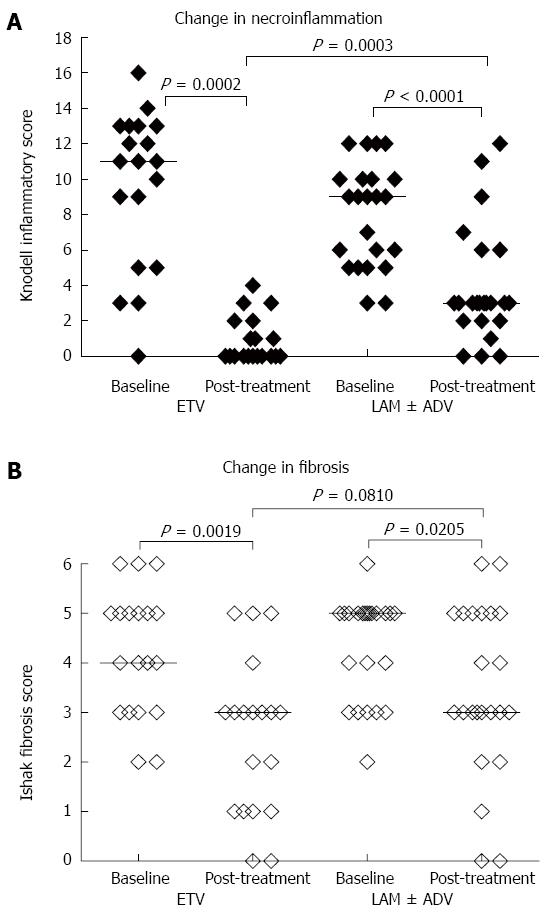
Figure 1 Plots of Knodell inflammatory scores (A) and Ishak fibrosis scores (B) of both entecavir and lamivudine arms at baseline and post-treatment.
ETV: Entecavir; LAM: Lamivudine; ADV: Adefovir.
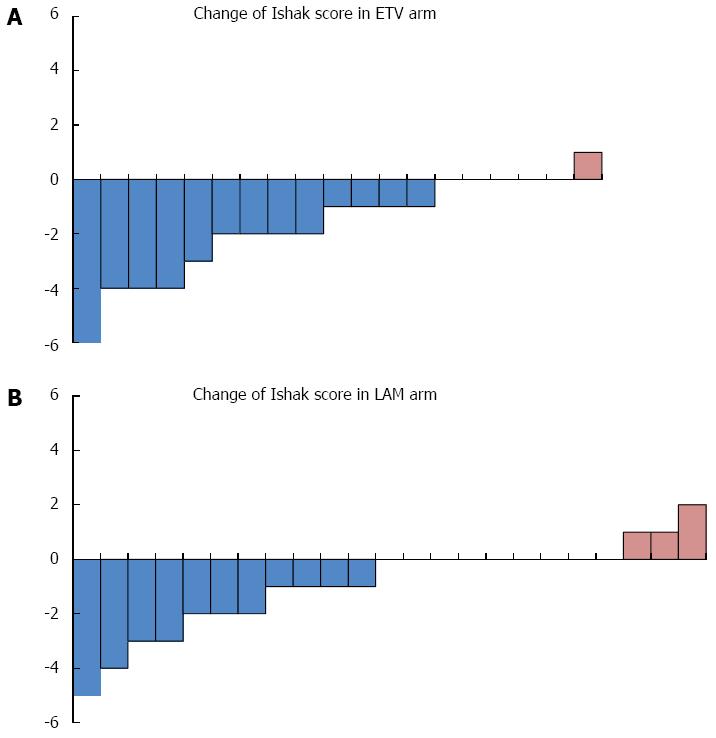
Figure 2 Changes between post- and pre-treatment Ishak fibrosis scores for all patients in the entecavir and lamivudine arms.
The blue columns indicate patients with improvement, and pink columns indicate progression. The scales indicate no change. ETV: Entecavir; LAM: Lamivudine.
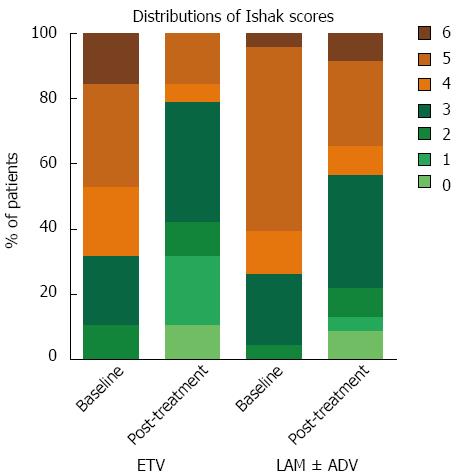
Figure 3 Distribution of Ishak fibrosis scores for the entecavir and lamivudine arms at baseline and post-treatment.
The green areas represent the percentage of patients who had an Ishak fibrosis score of 0 post-treatment. ETV: Entecavir; LAM: Lamivudine; ADV: Adefovir.
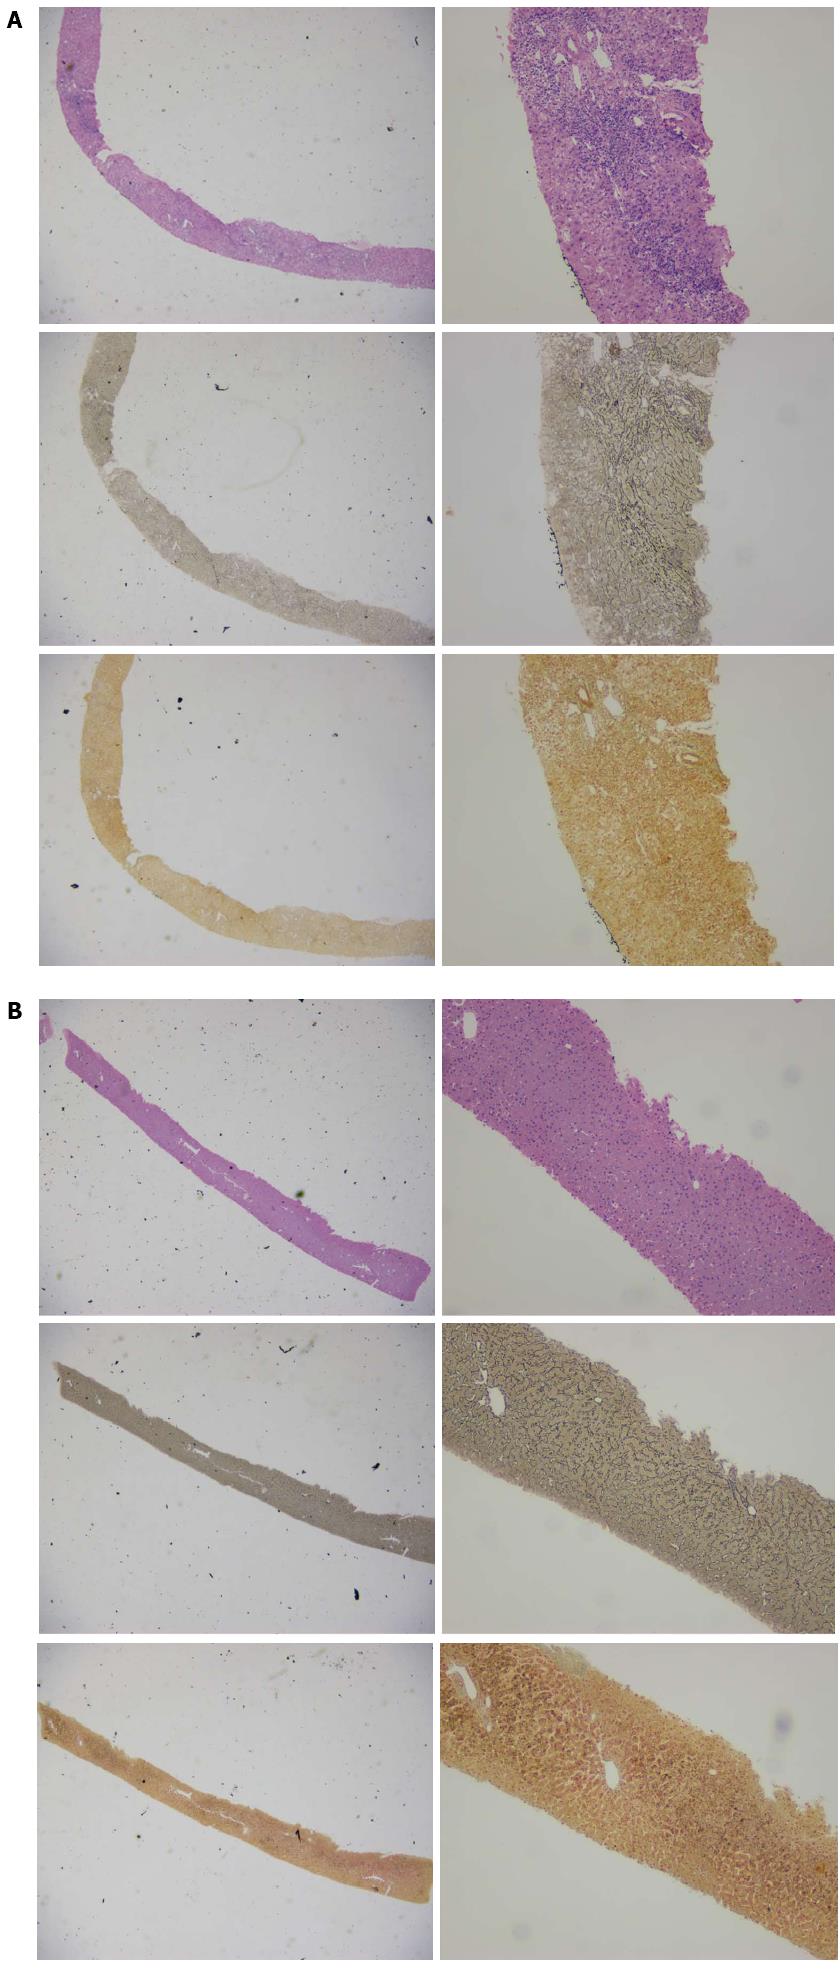
Figure 4 Pre- (A) and post-treatment (B) micrographs for a typical 35-year-old female patient with a favorable treatment outcome.
Hematoxylin-eosin, reticular fiber and Masson’s trichrome staining was used in each row of the photos, respectively; × 20 for the left column and × 100 for the right column, respectively.
-
Citation: Wang JL, Du XF, Chen SL, Yu YQ, Wang J, Hu XQ, Shao LY, Chen JZ, Weng XH, Zhang WH. Histological outcome for chronic hepatitis B patients treated with entecavir
vs lamivudine-based therapy. World J Gastroenterol 2015; 21(32): 9598-9606 - URL: https://www.wjgnet.com/1007-9327/full/v21/i32/9598.htm
- DOI: https://dx.doi.org/10.3748/wjg.v21.i32.9598


