Copyright
©The Author(s) 2015.
World J Gastroenterol. Aug 28, 2015; 21(32): 9566-9576
Published online Aug 28, 2015. doi: 10.3748/wjg.v21.i32.9566
Published online Aug 28, 2015. doi: 10.3748/wjg.v21.i32.9566
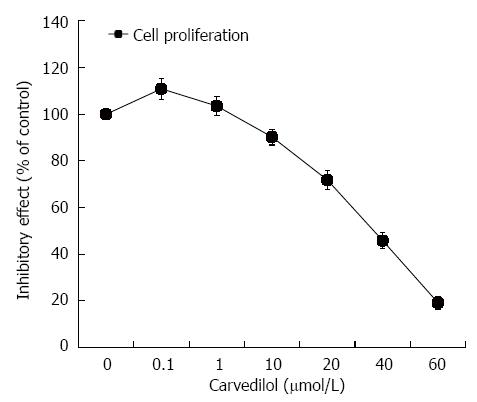
Figure 1 Effect of carvedilol on human umbilical vascular endothelial cell proliferation.
Subconfluent cultures of human umbilical vascular endothelial cells were exposed to increasing concentrations of carvedilol (0.01-40 μmol/L), and the extent of cell proliferation was measured by cholecystokinin-8 assay. The values are the means of three independent experiments.
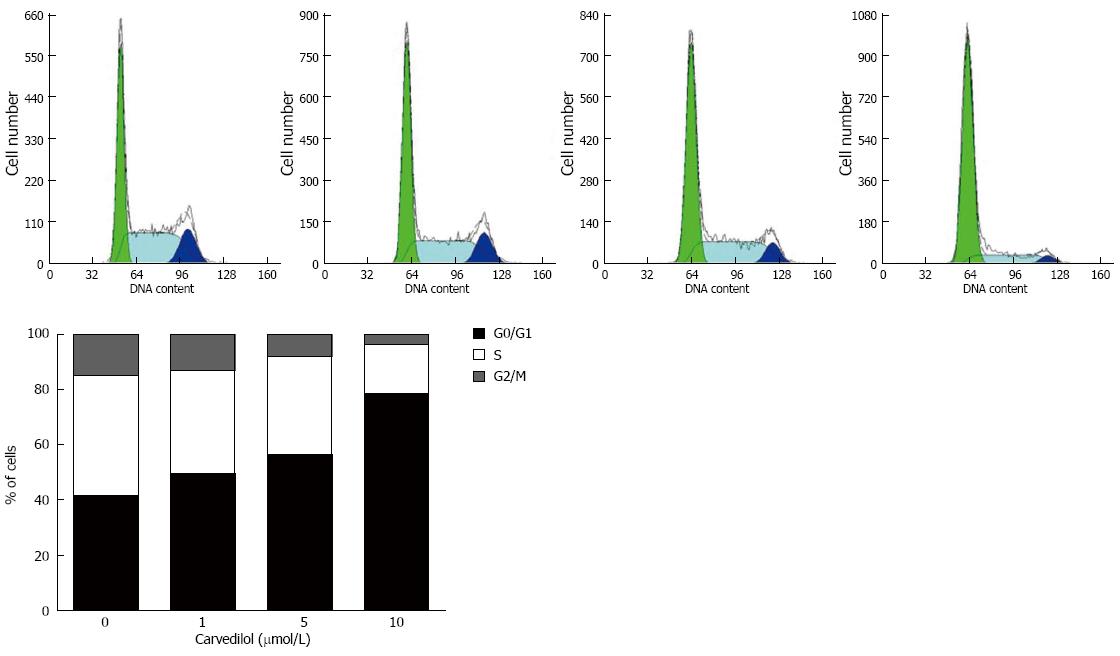
Figure 2 Effects of carvedilol on cell cycle progression in human umbilical vascular endothelial cells.
Cells were exposed to either control medium (containing 5% FBS) or medium containing the indicated concentrations of carvedilol and were treated as indicated in the Materials and Methods section. Representatives cytometric profiles (upper) and the percentage of cells at G0/G1, S and G2/M phases (%) (lower). The DNA content was determined by measuring the fluorescence intensity of incorporated propidium iodide.
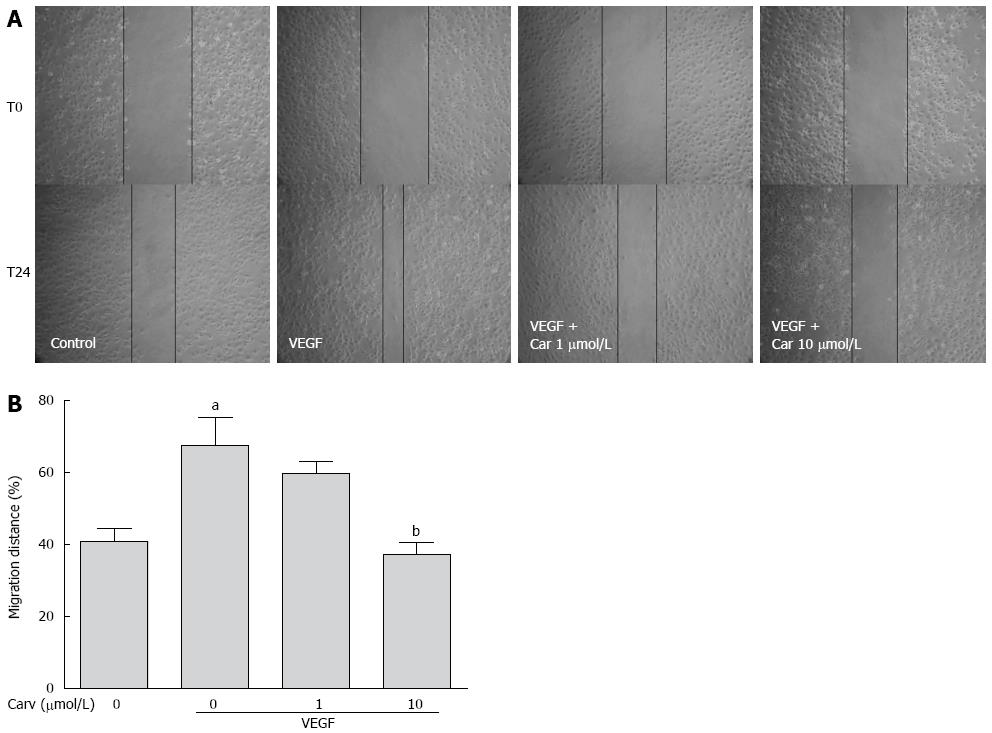
Figure 3 Effect of carvedilol on cell migration.
A: HUVECs were scraped and then treated with or without VEGF (50 ng/mL) and various concentrations of carvedilol. Images were taken at 0 and 24 h after scraping; B: Cell migration across the scraped area was determined using ImageJ software. (n = 12, aP < 0.05 vs control, bP < 0.01 vs VEGF alone). HUVEC: Human umbilical vascular endothelial cell; VEGF: Vascular endothelial growth factor.
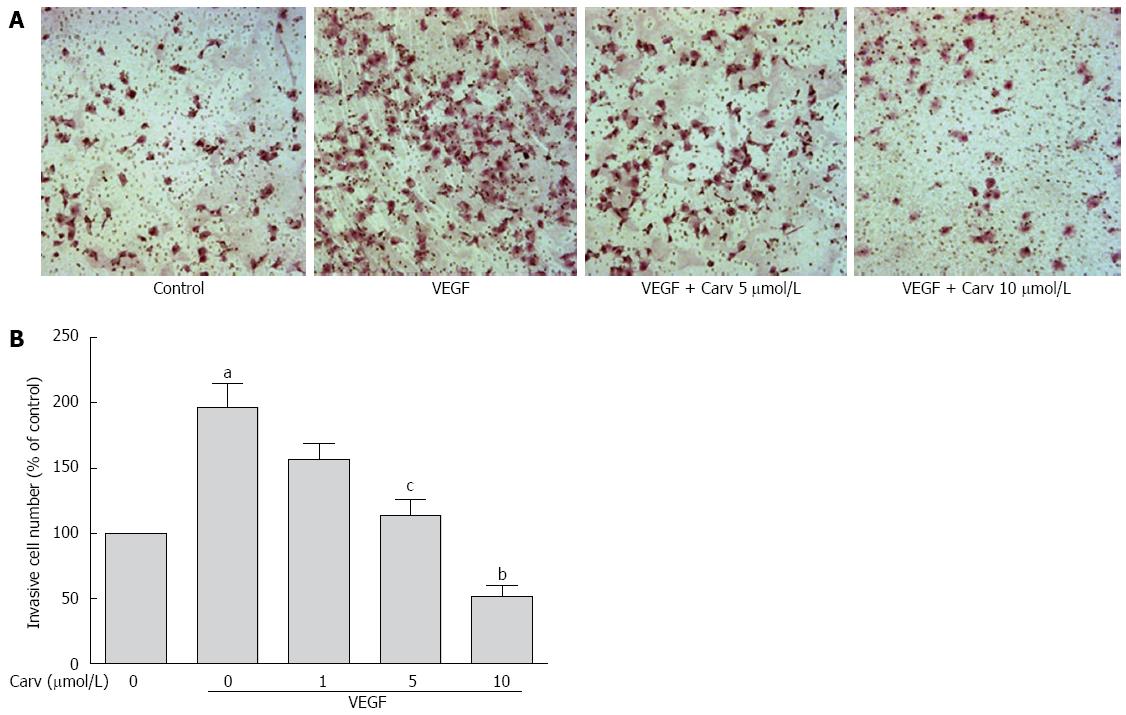
Figure 4 Effect of carvedilol on cell invasion.
A: HUVECs were seeded in the upper chamber of a Transwell and treated with various concentrations of carvedilol. The bottom chamber was filled with VEGF-enriched media. After 12 h, the HUVECs that migrated through the membrane were stained by hematoxylin and eosin; B: Cell numbers were quantified (n = 12, aP < 0.05 vs control, cP < 0.05, bP < 0.01 vs VEGF alone).
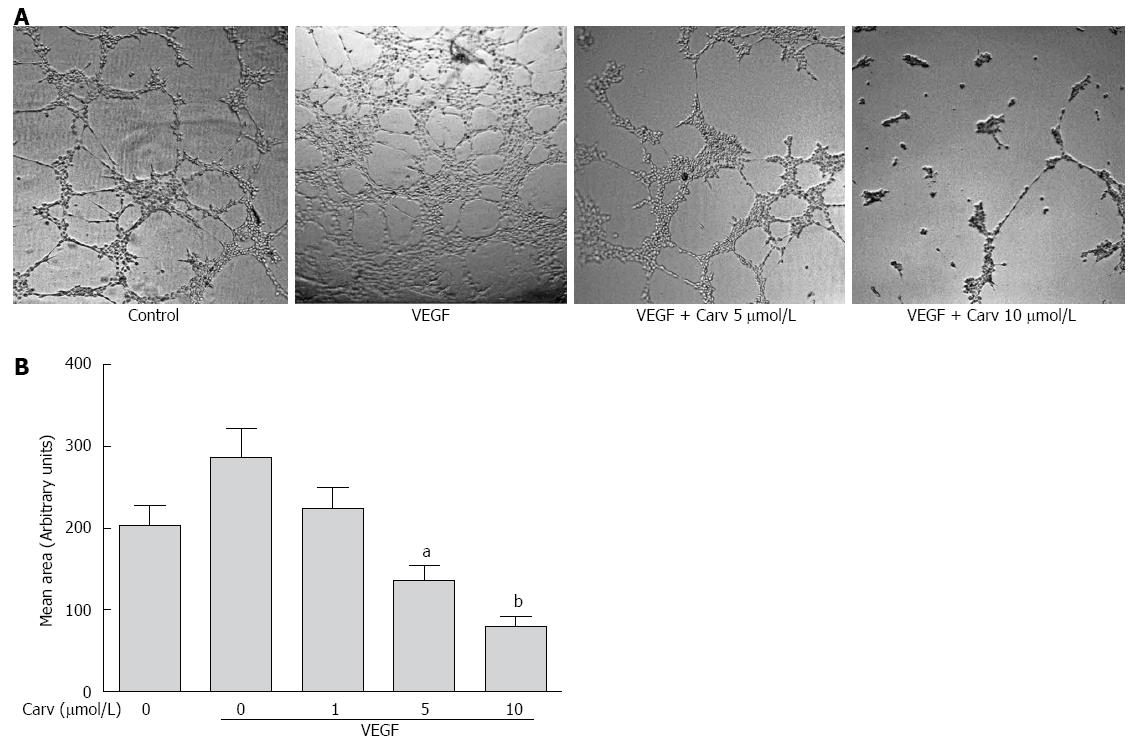
Figure 5 Carvedilol inhibited the vascular endothelial growth factor-induced tube formation of human umbilical vascular endothelial cells.
A: HUVECs were placed in Matrigel with or without VEGF (50 ng/mL) in the presence or absence of different concentrations of carvedilol. After 8 h, tubular structures were imaged (magnification, × 100); B: Quantification of the area of cell alignment was determined using ImageJ software (n = 3, aP < 0.05, bP < 0.01 vs VEGF alone).
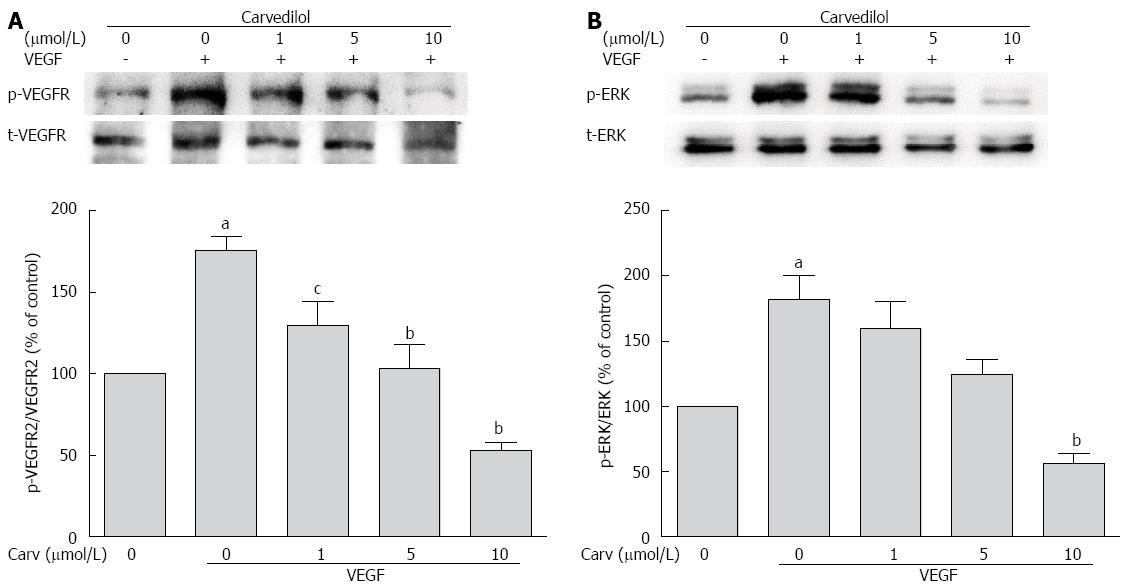
Figure 6 Effect of carvedilol on vascular endothelial growth factor angiogenic signaling.
HUVECs were treated with VEGF (50 ng/mL) for 2 h in the presence or absence of different concentrations of carvedilol. Cell lysates were processed as indicated in the Materials and Methods. p-VEGFR2/VEGFR2 (A) and p-ERK/ERK (B) levels (n = 3, aP < 0.05 vs control, cP < 0.05, bP < 0.01 vs VEGF alone). ERK: Extracellular signal-regulated kinase.
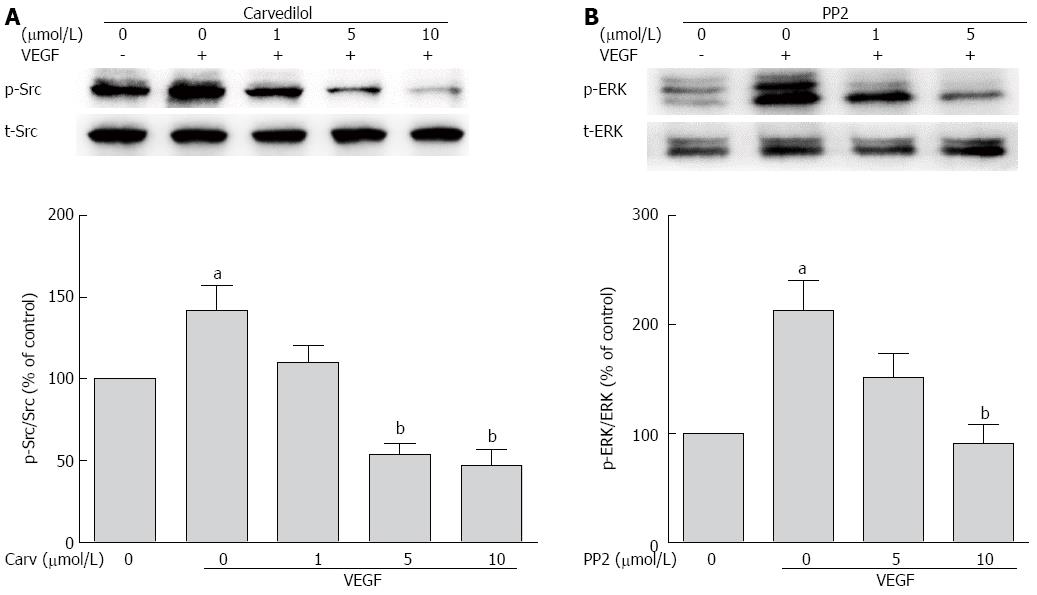
Figure 7 Role of Src in angiogenic signaling.
A: HUVECs were treated with VEGF (50 ng/mL) for 2 h in the presence or absence of different concentrations of PP2. Cell lysates were subjected to SDS-PAGE for Src phosphorylation; B: HUVECs were treated with VEGF (50 ng/mL) for 2 h in the presence or absence of different concentrations of PP2. Cell lysates were processed as indicated in the Materials and Methods (n = 3, aP < 0.05 vs control, bP < 0.01 vs VEGF alone).
- Citation: Ding Q, Tian XG, Li Y, Wang QZ, Zhang CQ. Carvedilol may attenuate liver cirrhosis by inhibiting angiogenesis through the VEGF-Src-ERK signaling pathway. World J Gastroenterol 2015; 21(32): 9566-9576
- URL: https://www.wjgnet.com/1007-9327/full/v21/i32/9566.htm
- DOI: https://dx.doi.org/10.3748/wjg.v21.i32.9566


