Copyright
©The Author(s) 2015.
World J Gastroenterol. Aug 21, 2015; 21(31): 9430-9436
Published online Aug 21, 2015. doi: 10.3748/wjg.v21.i31.9430
Published online Aug 21, 2015. doi: 10.3748/wjg.v21.i31.9430
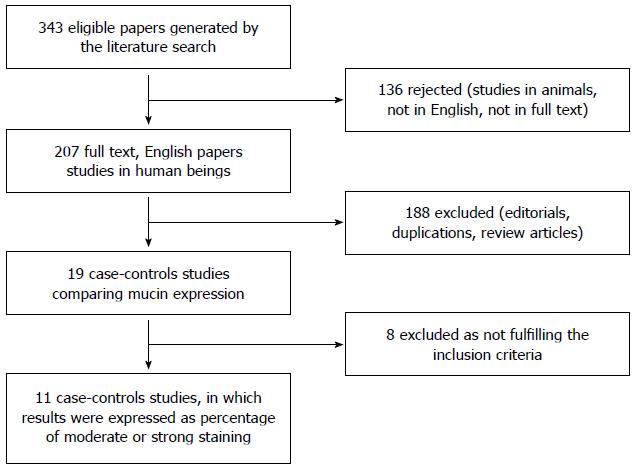
Figure 1 Flow chart of the articles identified in the meta-analysis.
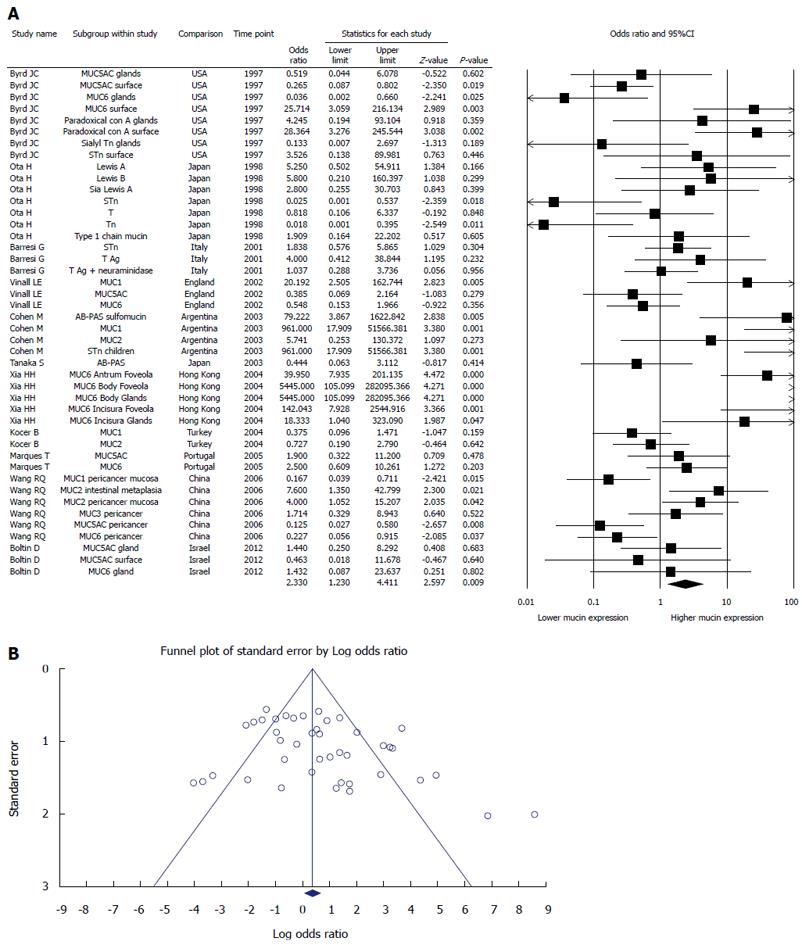
Figure 2 Meta-analysis of studies comparing mucin expression in the gastric epithelium of Helicobacter pylori positive and negative patients (A) and funnel plot for publication bias (B).
Including 11 papers and 53 studies.
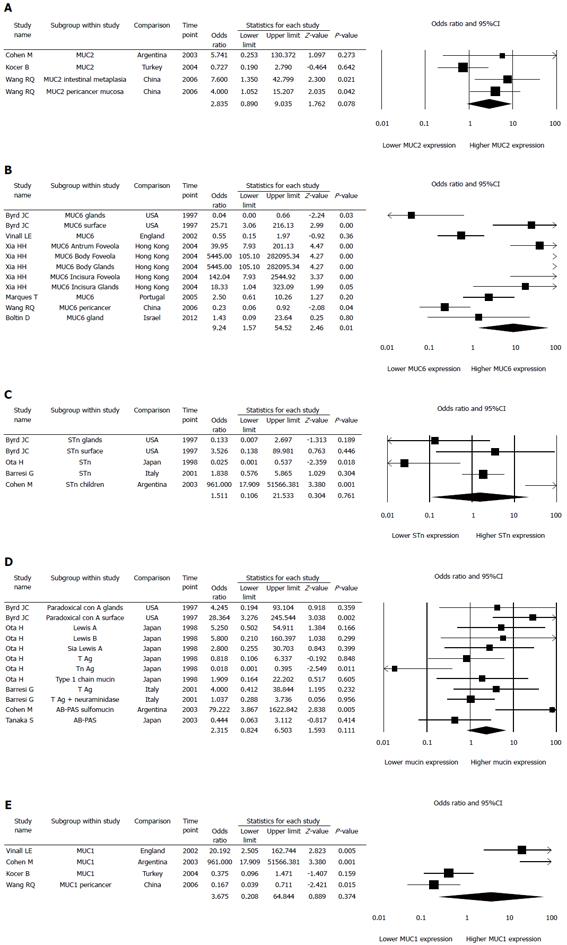
Figure 3 Nested meta-analysis of studies comparing specific mucins in the gastric epithelium demonstrating increased mucin expression in Helicobacter pylori positive than in Helicobacter pylori negative patients.
A: MUC2 (3 papers and 4 studies); B: MUC6 (6 papers and 11 studies); C: STn (4 papers and 5 studies); D: PcA, Tn, T, T1, LeA, SLeA, LeB, TN, AB-PAS (5 papers and 12 studies); E: MUC1 (4 papers, 4 studies).
Figure 4 Nested meta-analysis of sub-studies demonstrating decrease MUC5AC expression in the gastric epithelium of Helicobacter pylori positive than in Helicobacter pylori negative patients.
Including 5 papers and 7 studies.
-
Citation: Niv Y.
Helicobacter pylori and gastric mucin expression: A systematic review and meta-analysis. World J Gastroenterol 2015; 21(31): 9430-9436 - URL: https://www.wjgnet.com/1007-9327/full/v21/i31/9430.htm
- DOI: https://dx.doi.org/10.3748/wjg.v21.i31.9430


