Copyright
©The Author(s) 2015.
World J Gastroenterol. Aug 14, 2015; 21(30): 9118-9125
Published online Aug 14, 2015. doi: 10.3748/wjg.v21.i30.9118
Published online Aug 14, 2015. doi: 10.3748/wjg.v21.i30.9118
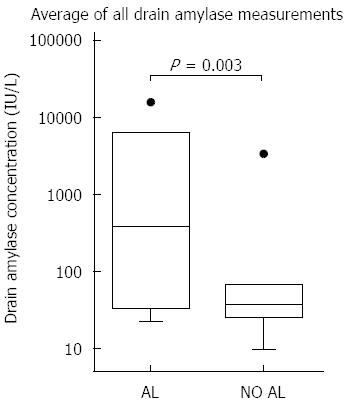
Figure 1 Whiskers-Tukey boxplot.
Comparison of median drain amylase levels using the average of all measurements. Dots in this figure are outliers. Al: Anastomotic leakage.
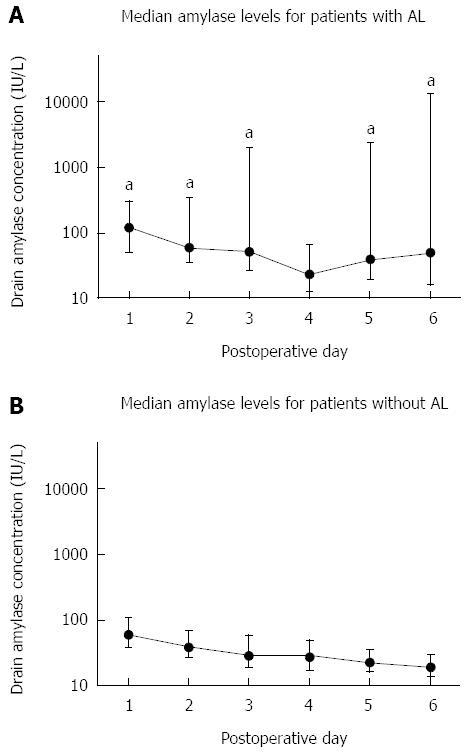
Figure 2 Daily median drain amylase levels in patients with (A) and without (B) anastomotic leakage.
Error bars represent interquartile range. aP < 0.05. Al: Anastomotic leakage.
- Citation: Berkelmans GH, Kouwenhoven EA, Smeets BJ, Weijs TJ, Silva Corten LC, van Det MJ, Nieuwenhuijzen GA, Luyer MD. Diagnostic value of drain amylase for detecting intrathoracic leakage after esophagectomy. World J Gastroenterol 2015; 21(30): 9118-9125
- URL: https://www.wjgnet.com/1007-9327/full/v21/i30/9118.htm
- DOI: https://dx.doi.org/10.3748/wjg.v21.i30.9118


