Copyright
©The Author(s) 2015.
World J Gastroenterol. Jan 21, 2015; 21(3): 1014-1019
Published online Jan 21, 2015. doi: 10.3748/wjg.v21.i3.1014
Published online Jan 21, 2015. doi: 10.3748/wjg.v21.i3.1014
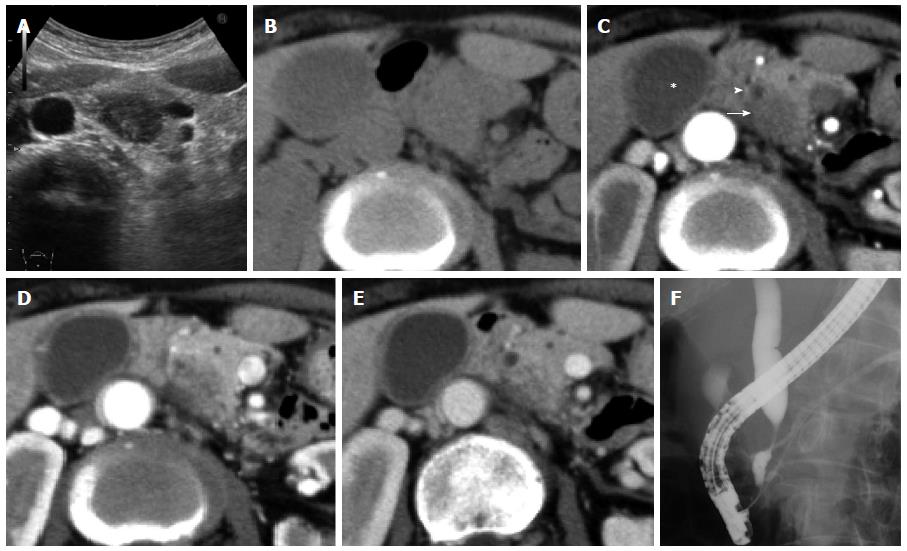
Figure 1 Preoperative images.
A: An ultrasonogram showing a slightly ill-defined hypoechoic mass at the pancreatic head; B-E Abdominal CT scans: The pancreatic mass is slightly hypodense on simple CT; C: Enhanced CT shows a non-enhancing mass (arrow) located adjacent to the bile duct (arrowhead) at the arterial phase. Note that the walls of the gallbladder (asterisk) and bile duct are thickened; D and E; The mass has sporadic enhancement at the later phase; F: A Cholangiogram showing a tapered distal biliary stricture consistent with extrinsic compression by the pancreatic mass. CT: Computed tomography.
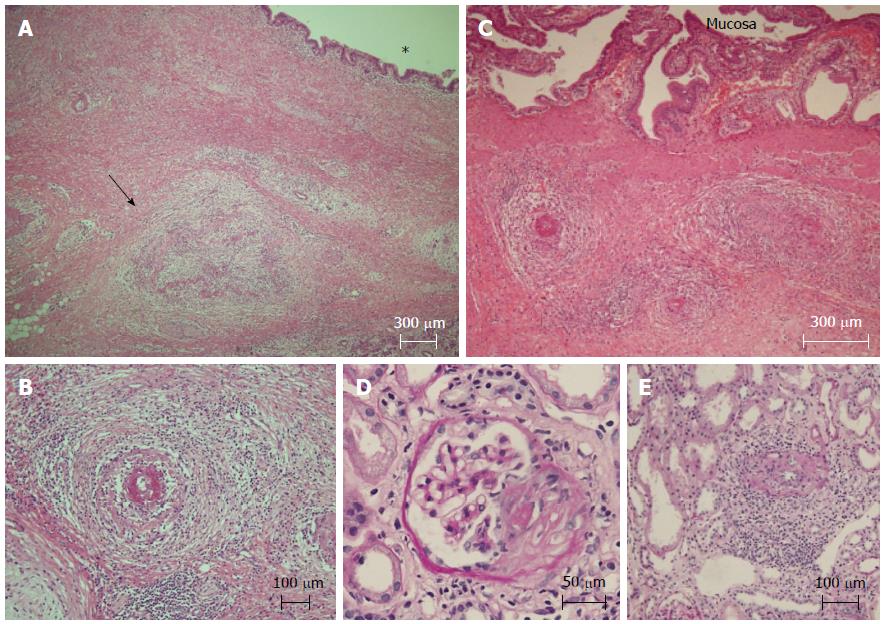
Figure 2 Histological findings of the pancreas, gallbladder and kidney.
A: Pancreatic fibrotic changes adjacent to the bile duct (asterisk) are evident. An obliterated medium-sized artery (arrow) is accompanied by cellular infiltration and destruction of the wall. The bile duct mucosa is intact (hematoxylin-eosin stain; original magnification, × 40); B: The affected small-sized artery in the pancreatic fibrosis is characterized by necrotizing arteritis with subintimal fibrinoid necrosis and inflammatory cell infiltration (hematoxylin-eosin stain; original magnification, × 100); C: The arteries of the gallbladder are also involved: the mucosa is preserved (hematoxylin-eosin stain; original magnification, × 40); D and E: Renal biopsy showed segmental sclerosis and collapse with a fibrocellular crescent (D: Periodic acid-Shiff’s stain, original magnification, × 200) and vasculitis of a small-sized artery (E: Periodic acid-Shiff’s stain, original magnification, × 100 ).
- Citation: Yokoi Y, Nakamura I, Kaneko T, Sawayanagi T, Watahiki Y, Kuroda M. Pancreatic mass as an initial manifestation of polyarteritis nodosa: A case report and review of the literature. World J Gastroenterol 2015; 21(3): 1014-1019
- URL: https://www.wjgnet.com/1007-9327/full/v21/i3/1014.htm
- DOI: https://dx.doi.org/10.3748/wjg.v21.i3.1014


