Copyright
©The Author(s) 2015.
World J Gastroenterol. Jul 28, 2015; 21(28): 8644-8652
Published online Jul 28, 2015. doi: 10.3748/wjg.v21.i28.8644
Published online Jul 28, 2015. doi: 10.3748/wjg.v21.i28.8644
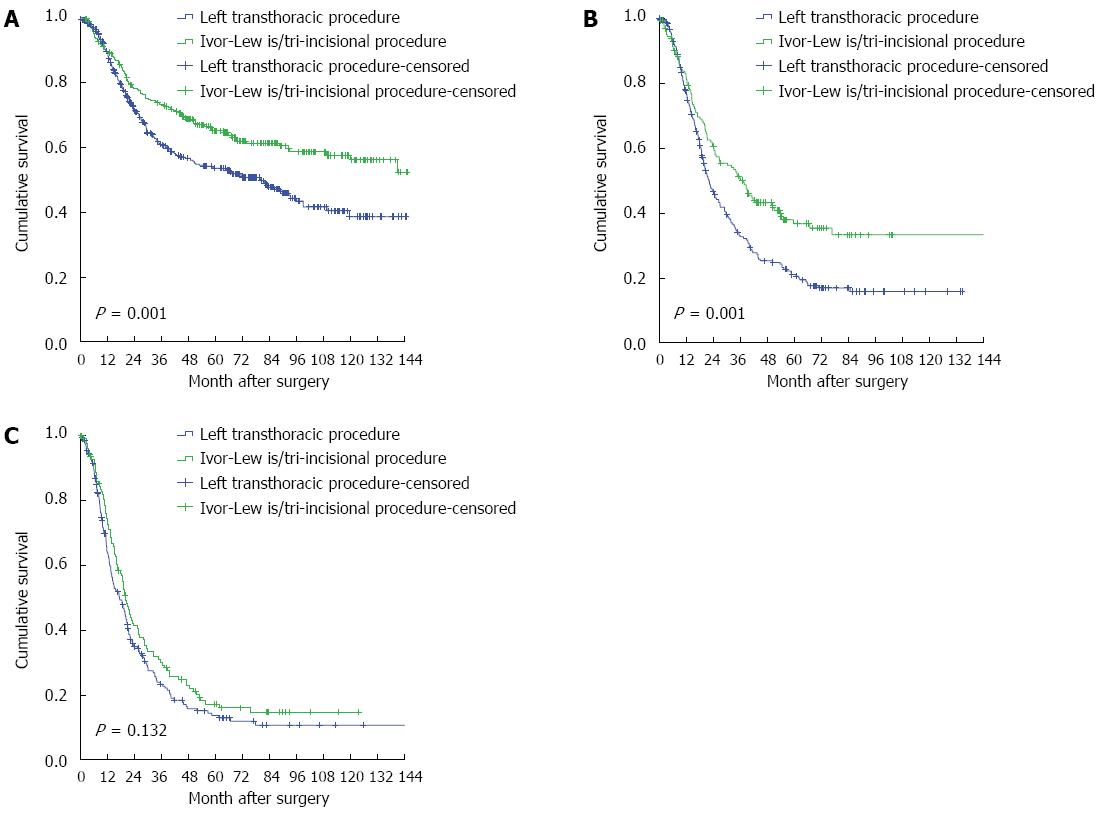
Figure 1 Overall survival curves stratified by surgical approaches for esophageal squamous cell carcinoma patients.
A: Patients with N0 status; B: Patients with N1 status; C: Patients with N2-3 status (Log-rank test).
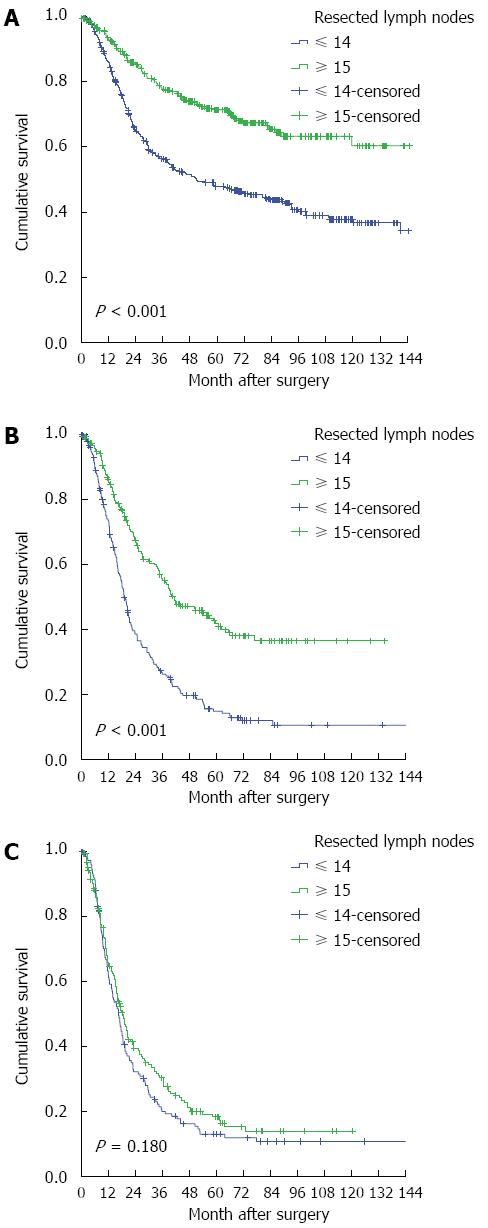
Figure 2 Overall survival curves stratified by resected lymph nodes for esophageal squamous cell carcinoma patients.
A: Patients with N0 status; B: Patients with N1 status; C: Patients with N2-3 status (Log-rank test).
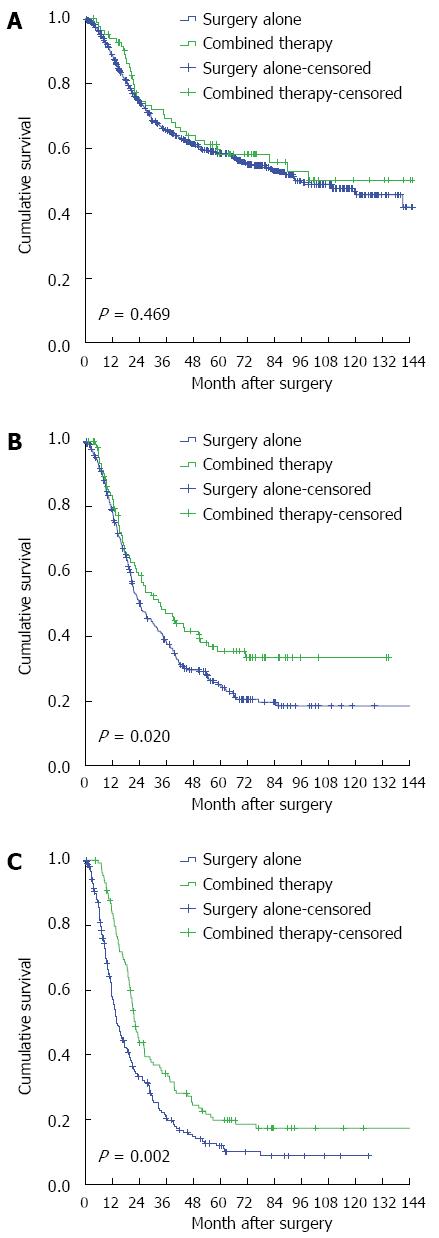
Figure 3 Overall survival curves stratified by treatment for oesophageal squamous cell carcinoma patients.
A: Patients with N0 status; B: Patients with N1 status; C: Patients with N2-3 status (Log-rank test).
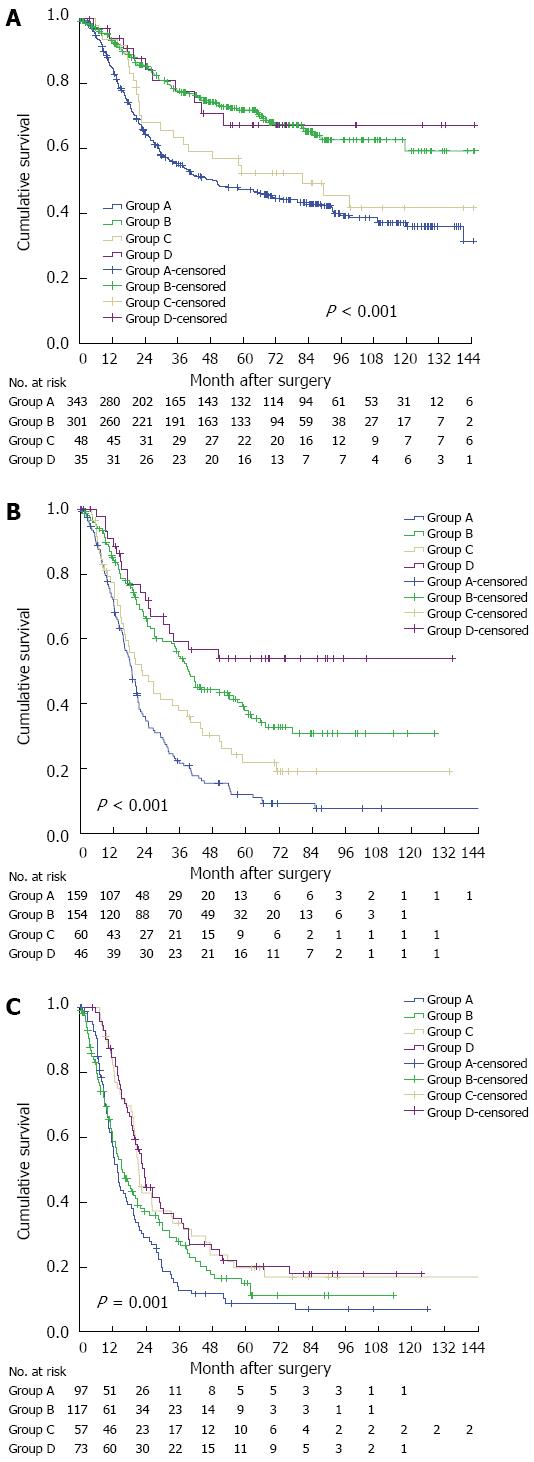
Figure 4 Overall survival curves stratified by therapeutic regimens for esophageal squamous cell carcinoma patients.
A: Patients with N0 status; B: Patients with N1 status; C: Patients with N2-3 status (Log-rank test). Group A, limited surgery alone; Group B, extensive surgery alone; Group C, limited surgery followed by adjuvant treatment; Group D, extensive surgery followed by adjuvant treatment.
- Citation: Zheng YZ, Zhao W, Hu Y, Ding-Lin XX, Wen J, Yang H, Liu QW, Luo KJ, Huang QY, Chen JY, Fu JH. Aggressive surgical resection does not improve survival in operable esophageal squamous cell carcinoma with N2-3 status. World J Gastroenterol 2015; 21(28): 8644-8652
- URL: https://www.wjgnet.com/1007-9327/full/v21/i28/8644.htm
- DOI: https://dx.doi.org/10.3748/wjg.v21.i28.8644


