Copyright
©The Author(s) 2015.
World J Gastroenterol. Jul 21, 2015; 21(27): 8425-8432
Published online Jul 21, 2015. doi: 10.3748/wjg.v21.i27.8425
Published online Jul 21, 2015. doi: 10.3748/wjg.v21.i27.8425
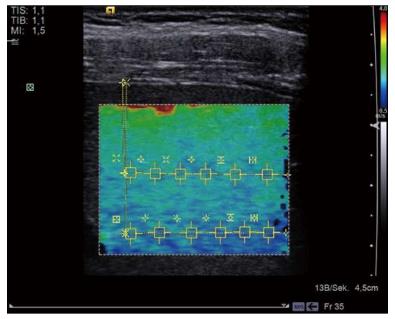
Figure 1 Virtual touch imaging quantification measurement in the right liver lobe at a depth of 15 mm and 25 mm from the liver capsule.
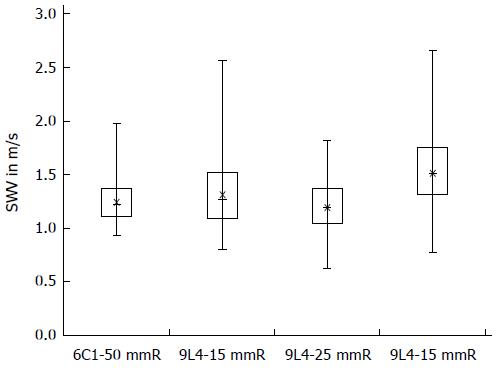
Figure 2 Box-plot diagram of the shear wave velocity for the two probes (6C1, 9L4) and the various depths in the right (R) and left (L) hepatic lobes.
- Citation: Galgenmueller S, Jaeger H, Kratzer W, Schmidt SA, Oeztuerk S, Haenle MM, Mason RA, Graeter T. Parameters affecting different acoustic radiation force impulse applications in the diagnosis of fibrotic liver changes. World J Gastroenterol 2015; 21(27): 8425-8432
- URL: https://www.wjgnet.com/1007-9327/full/v21/i27/8425.htm
- DOI: https://dx.doi.org/10.3748/wjg.v21.i27.8425


