Copyright
©The Author(s) 2015.
World J Gastroenterol. Jul 7, 2015; 21(25): 7884-7894
Published online Jul 7, 2015. doi: 10.3748/wjg.v21.i25.7884
Published online Jul 7, 2015. doi: 10.3748/wjg.v21.i25.7884
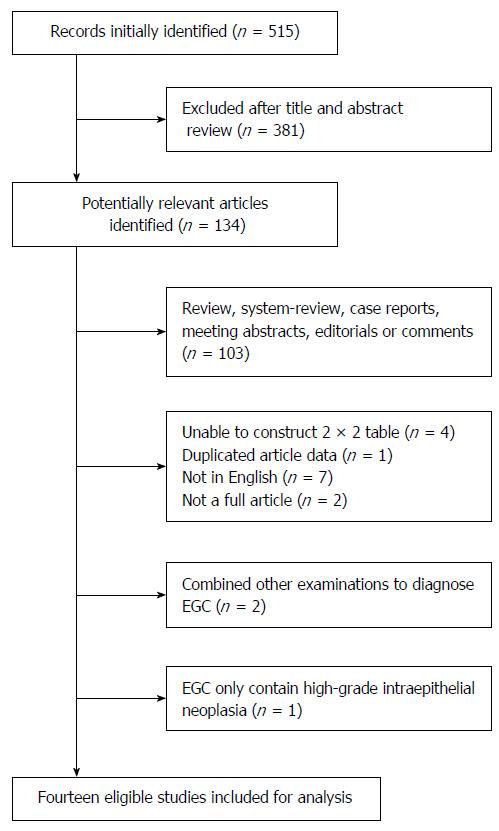
Figure 1 Literature search flow diagram.
EGC: Early gastric cancer.
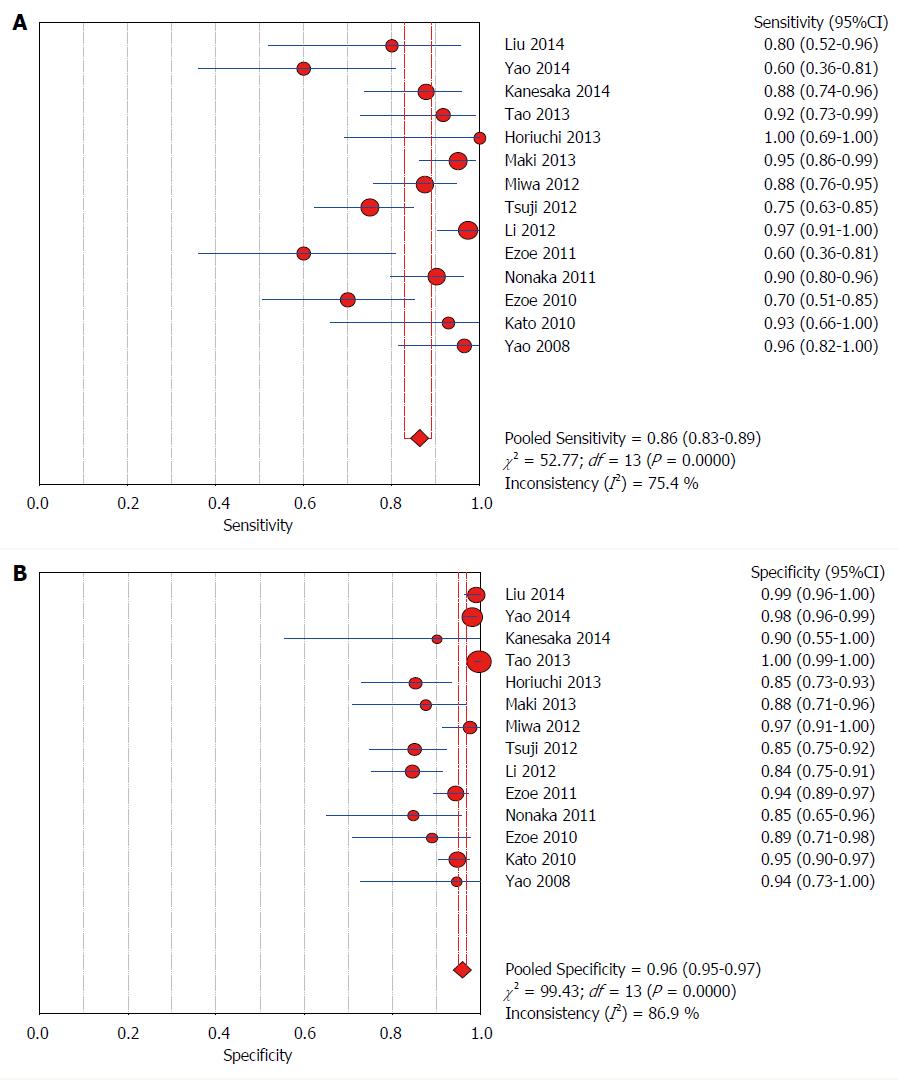
Figure 2 Forest plot showing pooled sensitivity and specificity of magnifying endoscopy with narrow-band imaging for early gastric cancer.
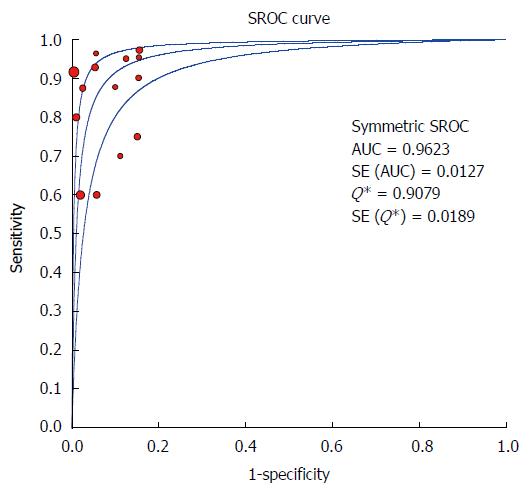
Figure 3 Summary receiver operating characteristic curve showing the diagnostic performance of magnifying endoscopy with narrow-band imaging for early gastric cancer.
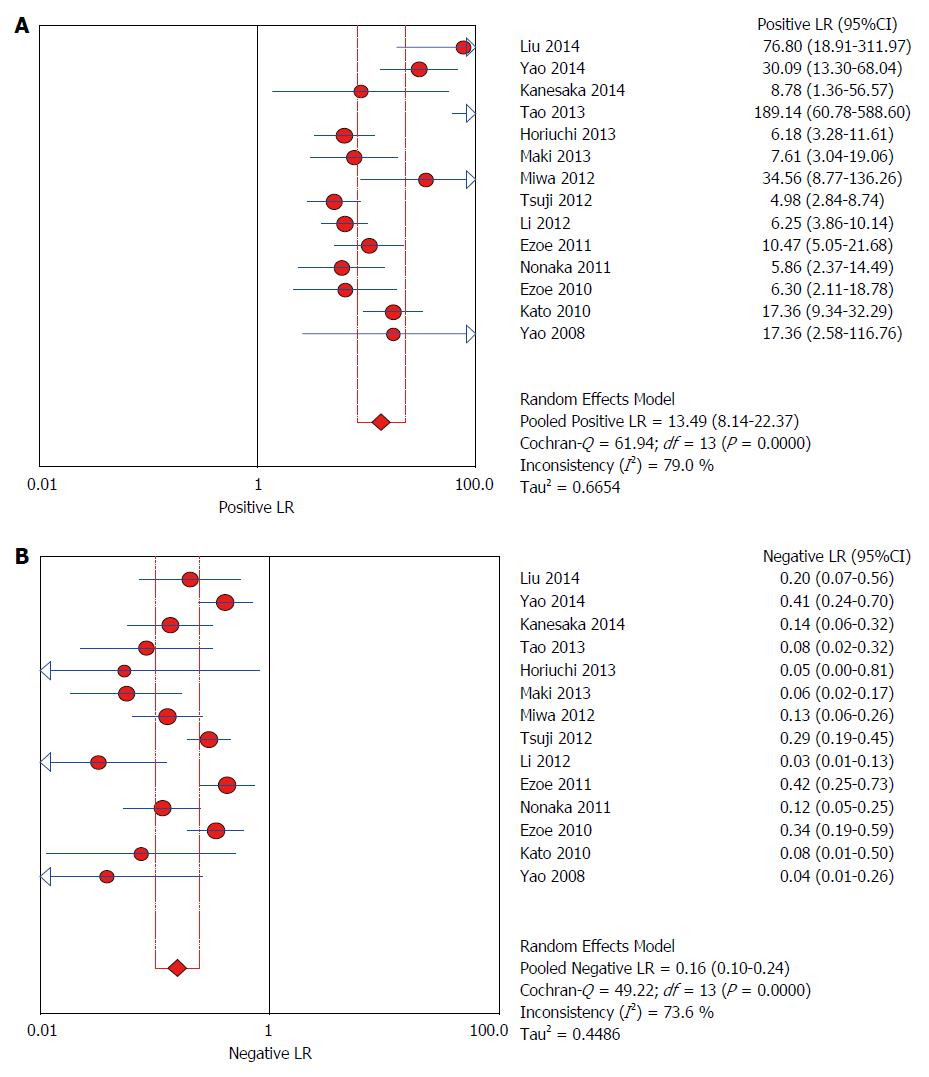
Figure 4 Forest plot showing the positive likelihood ratio and negative likelihood ratio of magnifying endoscopy with narrow-band imaging for early gastric cancer.
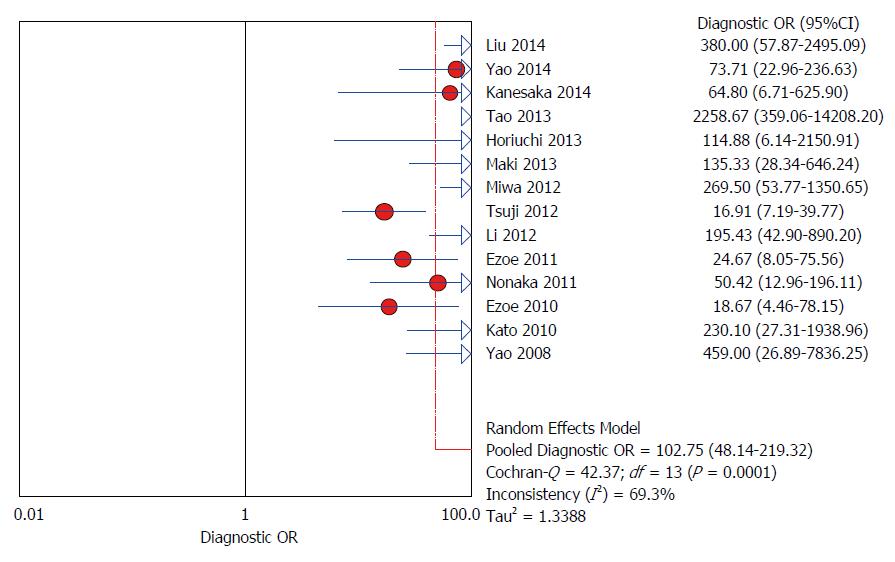
Figure 5 Forest plot showing diagnostic odds ratios of magnifying endoscopy with narrow-band imaging for early gastric cancer.
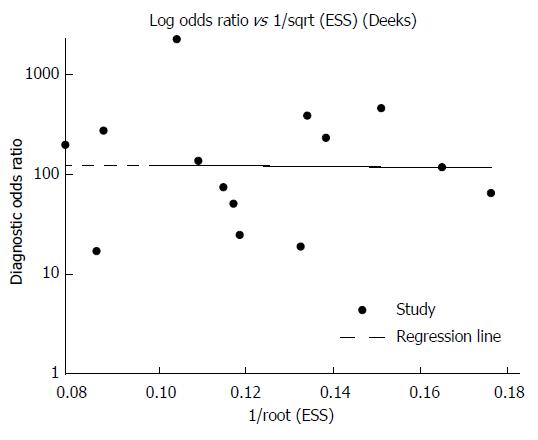
Figure 6 Deeks’ funnel plot for publication bias.
ESS: Effective sample size.
- Citation: Hu YY, Lian QW, Lin ZH, Zhong J, Xue M, Wang LJ. Diagnostic performance of magnifying narrow-band imaging for early gastric cancer: A meta-analysis. World J Gastroenterol 2015; 21(25): 7884-7894
- URL: https://www.wjgnet.com/1007-9327/full/v21/i25/7884.htm
- DOI: https://dx.doi.org/10.3748/wjg.v21.i25.7884


