Copyright
©The Author(s) 2015.
World J Gastroenterol. Jul 7, 2015; 21(25): 7869-7876
Published online Jul 7, 2015. doi: 10.3748/wjg.v21.i25.7869
Published online Jul 7, 2015. doi: 10.3748/wjg.v21.i25.7869
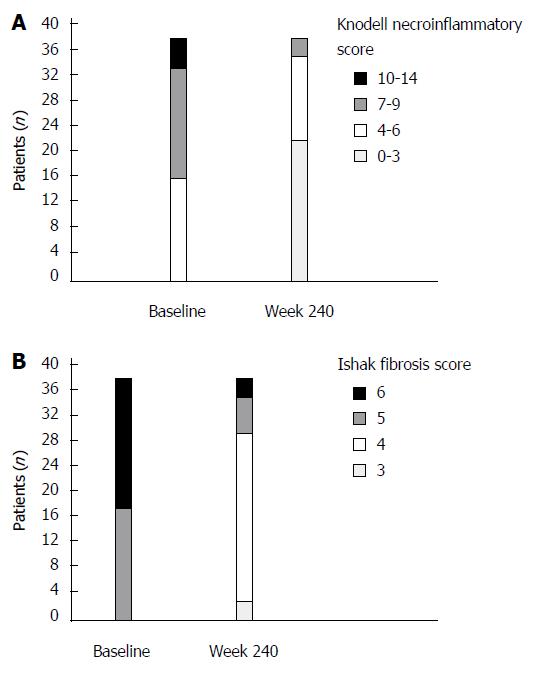
Figure 1 Improvements in liver histology at week 240 of entecavir treatment in patients (n = 38) with paired liver biopsies (baseline and week 240).
A: Distribution of Knodell necroinflammatory scores at baseline and at week 240; B: Distribution of Ishak fibrosis scores at baseline and at week 240.
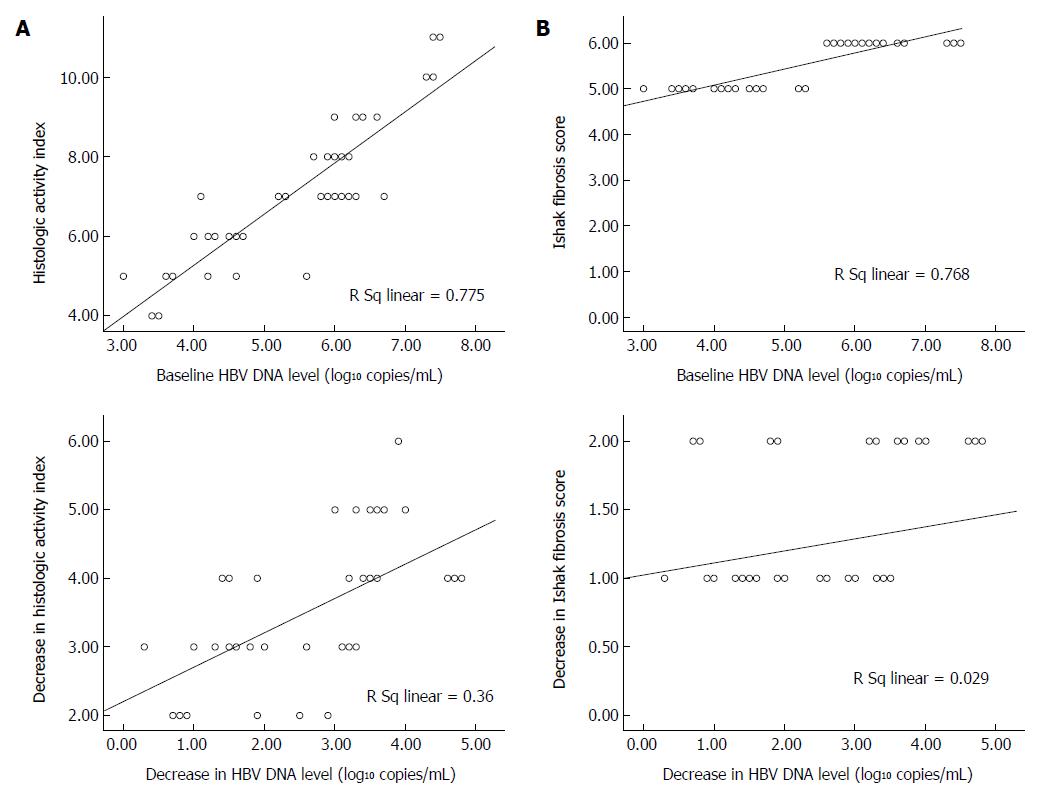
Figure 2 Relationship between hepatitis B virus DNA level and histologic improvement.
A: Relationships between hepatitis B virus (HBV) DNA level and Knodell histologic activity index and Ishak fibrosis score at baseline; B: Relationships between changes from baseline in HBV DNA level and Knodell histologic activity index and Ishak fibrosis score at week 240 of entecavir treatment.
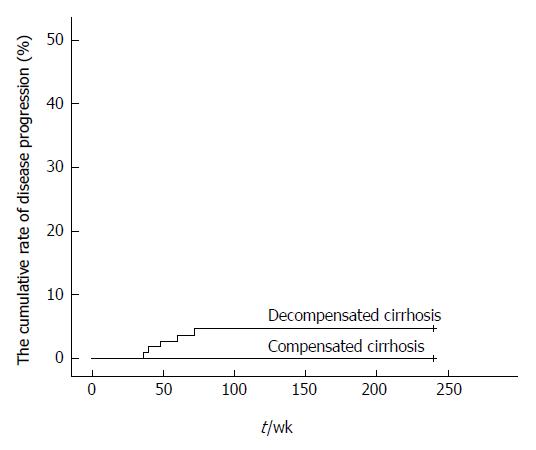
Figure 3 Proportion of patients with disease progression in compensated and decompensated cirrhosis groups.
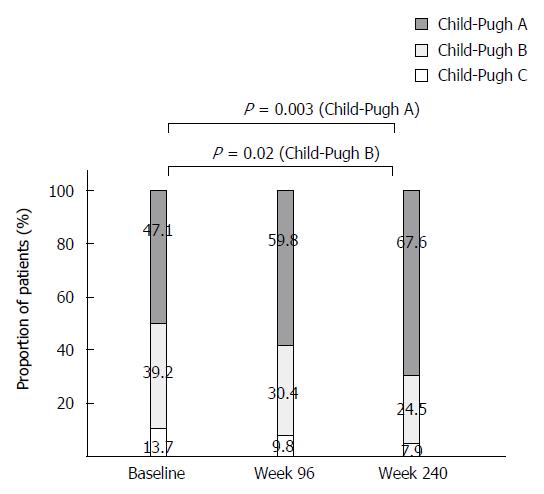
Figure 4 Improvements in Child-Pugh grade at weeks 96 and 240 of entecavir treatment in patients with compensated and decompensated cirrhosis.
- Citation: Xu Y, Zhang YG, Wang X, Qi WQ, Qin SY, Liu ZH, Jiao J, Wang JB. Long-term antiviral efficacy of entecavir and liver histology improvement in Chinese patients with hepatitis B virus-related cirrhosis. World J Gastroenterol 2015; 21(25): 7869-7876
- URL: https://www.wjgnet.com/1007-9327/full/v21/i25/7869.htm
- DOI: https://dx.doi.org/10.3748/wjg.v21.i25.7869


