Copyright
©The Author(s) 2015.
World J Gastroenterol. Jul 7, 2015; 21(25): 7805-7813
Published online Jul 7, 2015. doi: 10.3748/wjg.v21.i25.7805
Published online Jul 7, 2015. doi: 10.3748/wjg.v21.i25.7805
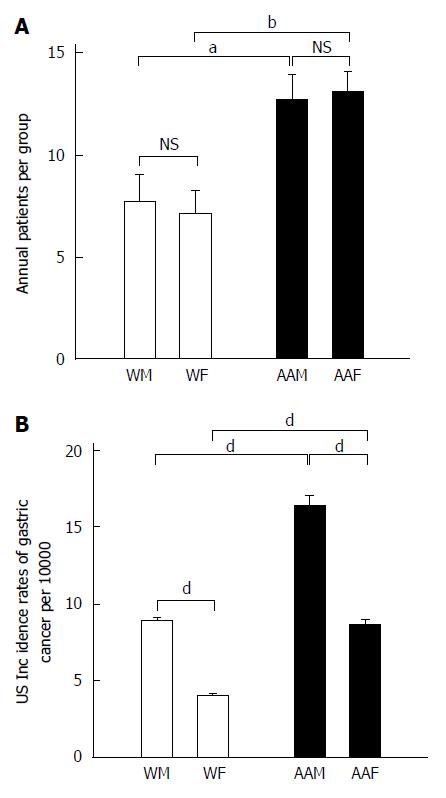
Figure 1 Gastric cancer at Louisiana State University Health Sciences Center-Shreveport: Influence of ethnicity and gender.
A: The average individual number of patients (per group) treated annually for gastric cancer is highest in AAs. There were significantly more AAFs than WFs (bP < 0.01), and AAMs had more annual gastric cancer diagnoses than WMs (aP < 0.05). The number of WMs was not significantly different from that of WFs; and the number of AAMs was not significantly different from that of AAFs; B: National trends in gastric cancer - Influence of ethnicity and gender. AAMs had more annual gastric cancer diagnoses than AAFs (dP < 0.001) and WMs (dP < 0.001). AAFs had more annual gastric cancer diagnoses than WFs (dP < 0.001). WMs had more annual gastric cancer diagnoses than WFs (dP < 0.001). WMs: Non-Hispanic white males; WFs: Non-Hispanic white females; AAMs: African American males; AAFs: African American females; NS: Not significant.
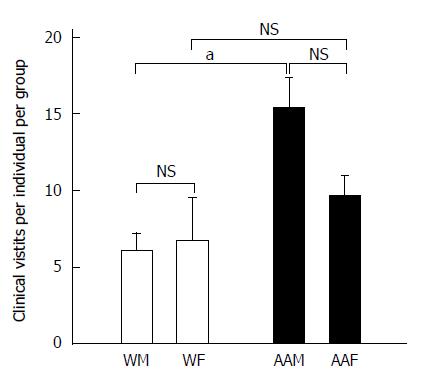
Figure 2 Annual gastric cancer patients’ clinic visits per person.
AAMs had a higher annual average of clinic visits than WMs (aP < 0.05). The number of AAMs was not significantly different from that of AAFs, and the number of WFs was not significantly different from that of WMs. WMs: Non-Hispanic white males; AAMs: African American males; AAFs: African American females; NS: Not significant.
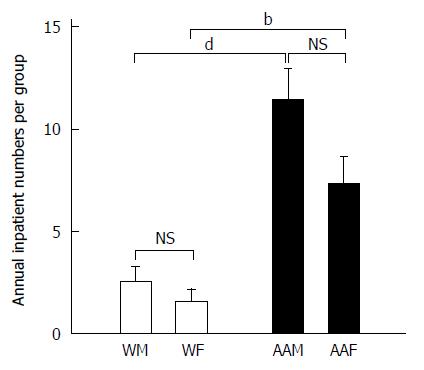
Figure 3 Annual gastric cancer inpatient visits per patient visits.
AAMs had more annual inpatient visits than WMs (dP < 0.001). AAFs had more annual inpatient visits than WFs (bP < 0.01). The number of AAM visits was not significantly different from the number of AAF visits; and the number of WF visits was not significantly different from the number of WM visits. WFs: Non-Hispanic white females; AAMs: African American males; AAFs: African American females.
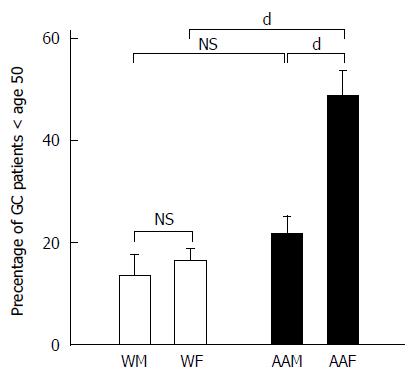
Figure 4 Gastric cancer patients younger than 50 years of age.
AAFs had more gastric cancer diagnoses than AAMs (dP < 0.001), WFs (dP < 0.001) and WMs (dP < 0.001). AAMs: African American males; AAFs: African American females; GC: Gastric cancer.
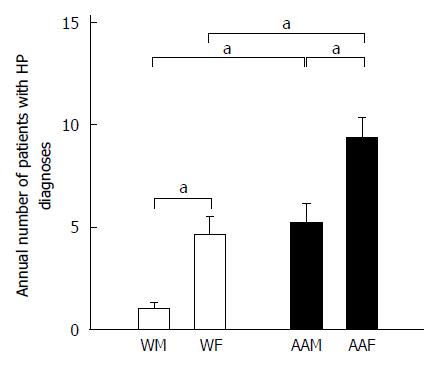
Figure 5 Annual Helicobacter pylori infection diagnoses.
AAFs had more annual H. pylori infection diagnoses than either AAMs (aP < 0.05) or WFs (aP < 0.05). AAMs had more annual H. pylori diagnoses than WMs (aP < 0.05). WFs had more annual H. pylori diagnoses than WMs (aP < 0.05). Helicobacter pylori: H. pylori.
- Citation: Suryawala K, Soliman D, Mutyala M, Nageeb S, Boktor M, Seth A, Aravantagi A, Sheth A, Morris J, Jordan P, Manas K, Cvek U, Trutschl M, Becker F, Alexander J. Gastric cancer in women: A regional health-center seven year retrospective study. World J Gastroenterol 2015; 21(25): 7805-7813
- URL: https://www.wjgnet.com/1007-9327/full/v21/i25/7805.htm
- DOI: https://dx.doi.org/10.3748/wjg.v21.i25.7805


