Copyright
©The Author(s) 2015.
World J Gastroenterol. Jun 21, 2015; 21(23): 7155-7164
Published online Jun 21, 2015. doi: 10.3748/wjg.v21.i23.7155
Published online Jun 21, 2015. doi: 10.3748/wjg.v21.i23.7155
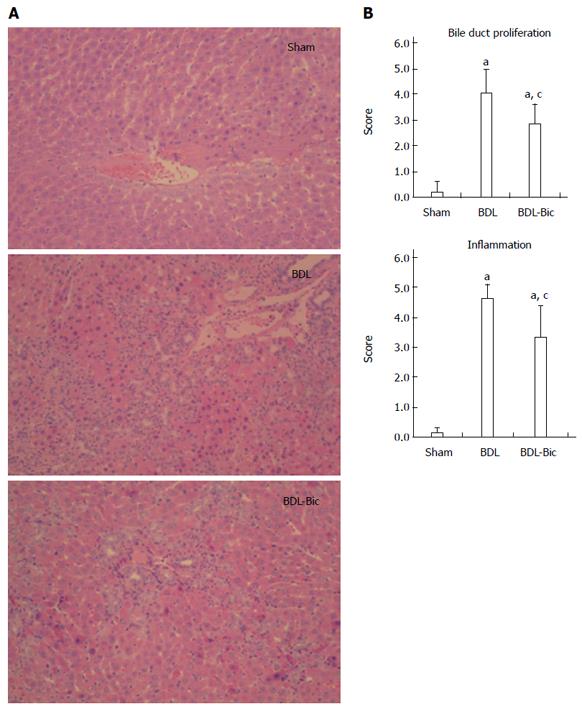
Figure 1 Effects of bicyclol on liver histology of bile duct ligation rats.
Bile duct ligation (BDL) group consisted of animals submitted to undergo BDL operative manipulation and sham-operated animals were used as healthy control. BDL rats were divided into two groups, which orally received sterilized PBS or bicyclol [100 mg/(kg•d)] for consecutive 14 d. Representative HE liver histology (magnification × 200) (A) and blinded quantitative assessment of liver bile duct ligation (B). Data are expressed as mean ± SD of 6 animals per group. aP < 0.05 vs Sham group; cP < 0.05 vs BDL group. Sham: Sham group; BDL: BDL group; BDL-Bic: Bicyclol group.
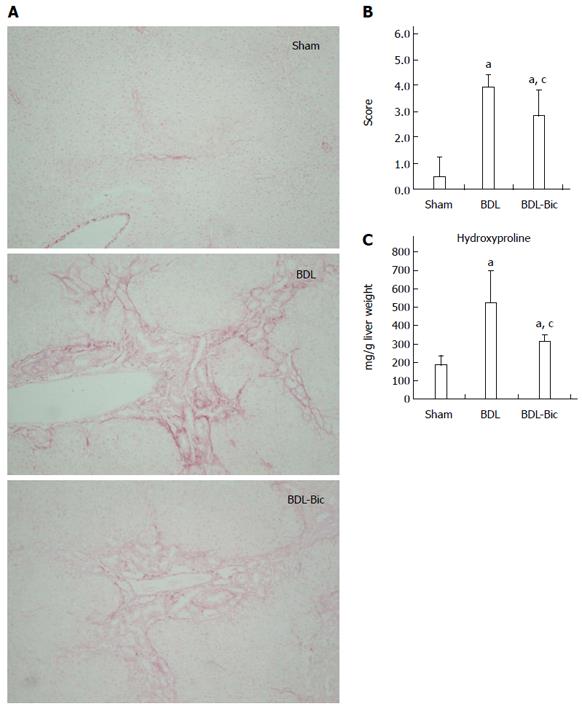
Figure 2 Effects of bicyclol on liver fibrosis of bile duct ligation rats.
Bile duct ligation (BDL) group consisted of animals submitted to undergo BDL operative manipulation and sham-operated animals were used as healthy control. BDL rats were divided into two groups, which orally received sterilized PBS or bicyclol [100 mg/(kg·d)] for consecutive 14 d. Liver sections were stained by Sirius red-stained sections (magnification × 200) (A) and quantified by blinded assessment (B). Hydroxyproline was assayed with frozen liver tissues (C). Data are expressed as mean ± SD of 6 animals per group. aP < 0.05 vs Sham group; cP < 0.05 vs BDL group. Sham: Sham group; BDL: BDL group; BDL-Bic: Bicyclol group.
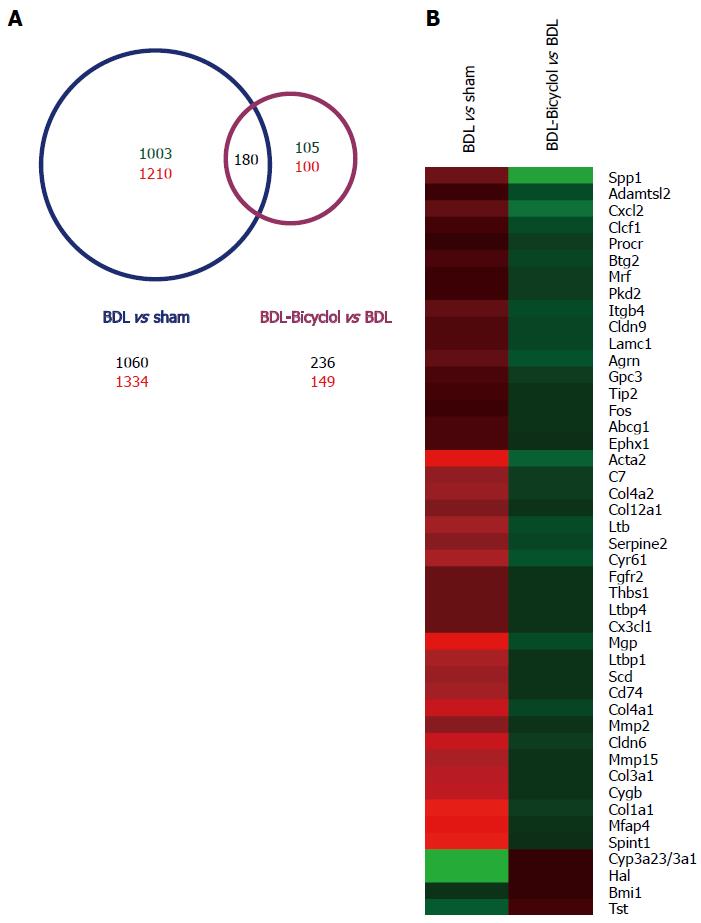
Figure 3 Microarray analysis of rat liver tissues.
Total RNA was isolated from the liver tissues, then each group of total RNA was mixed with the same amount of total RNA from each animal, then labeled with Cy3/Cy5 and measured by microarray assay. Red: increase in gene expression; green: decrease in gene expression; A: Number of genes significant changed in microarray assays; B: 45 fibrogenesis related genes reversed by bicyclol treatment.
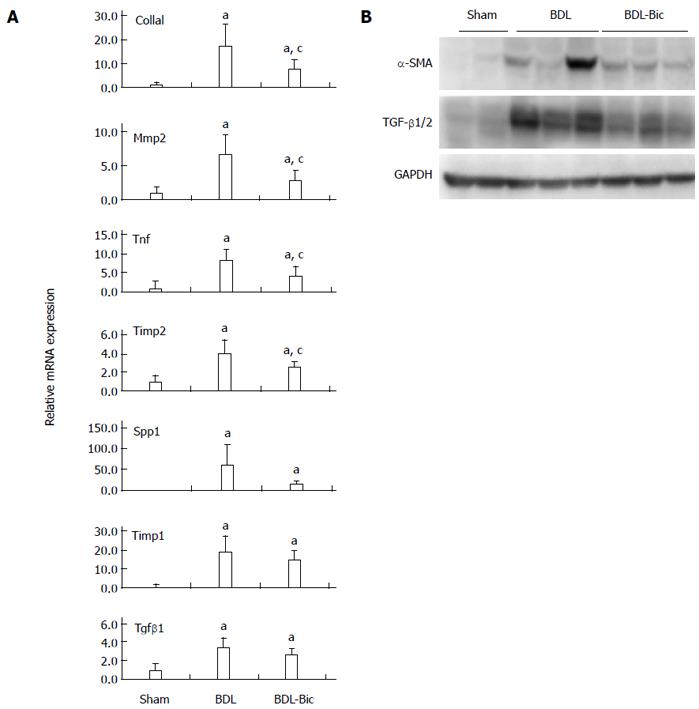
Figure 4 Effects of bicyclol on the fibrogenic gene expression.
The mRNA expression levels were assayed by reverse transcription quantitative-polymerase chain reaction with TaqMan gene expression kits (A), Western blot analysis of α-smooth muscle actin (α-SMA) and transforming growth factor (TGF)-β1/2 expression in each bile duct ligation (BDL) rat liver (B) and normalized against Gapdh. Data are expressed as mean ± SD of 6 animals per group. aP < 0.05 vs Sham group; cP < 0.05 vs BDL group. Sham: Sham group; BDL: BDL group; BDL-Bic: Bicyclol group.
- Citation: Zhen YZ, Li NR, He HW, Zhao SS, Zhang GL, Hao XF, Shao RG. Protective effect of bicyclol against bile duct ligation-induced hepatic fibrosis in rats. World J Gastroenterol 2015; 21(23): 7155-7164
- URL: https://www.wjgnet.com/1007-9327/full/v21/i23/7155.htm
- DOI: https://dx.doi.org/10.3748/wjg.v21.i23.7155


