Copyright
©The Author(s) 2015.
World J Gastroenterol. Jun 7, 2015; 21(21): 6604-6612
Published online Jun 7, 2015. doi: 10.3748/wjg.v21.i21.6604
Published online Jun 7, 2015. doi: 10.3748/wjg.v21.i21.6604
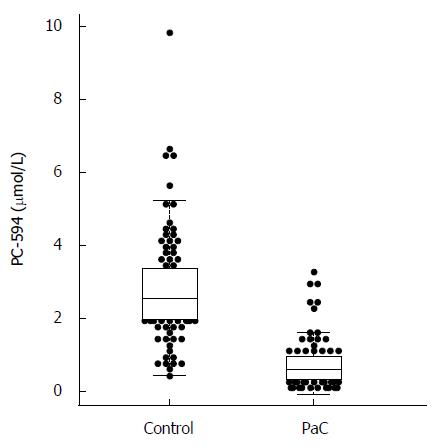
Figure 1 Beeswarm scatter plot of PC-594 levels in control and pancreatic cancer patient sera.
Boxes indicate the 25th to 75th percentile, while the horizontal line in the box represents the median level. Whiskers indicate the 5th to 95th percentile.
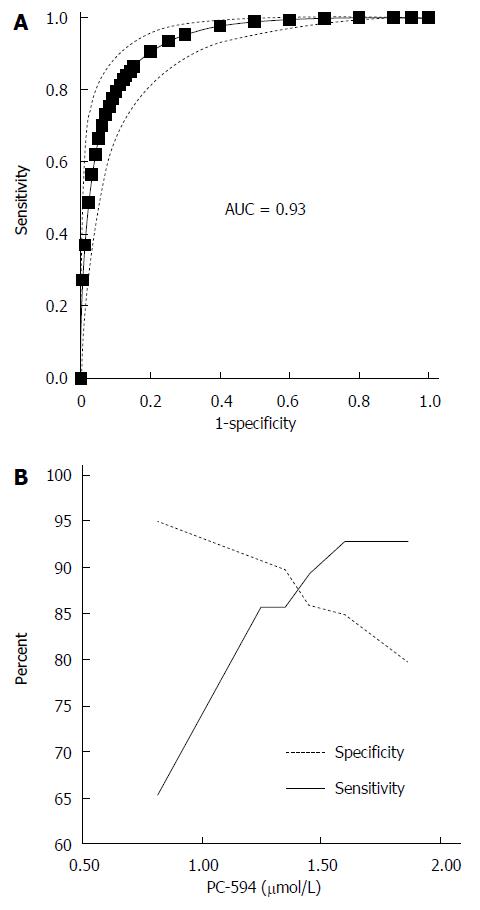
Figure 2 Receiver-operator characteristic analysis of PC-594.
A: ROC curve based on PC-594 levels in PaC and control subjects, Dotted lines indicate the 95%CI; B: Line pots of sensitivity and specificity vs serum PC-594 concentration.
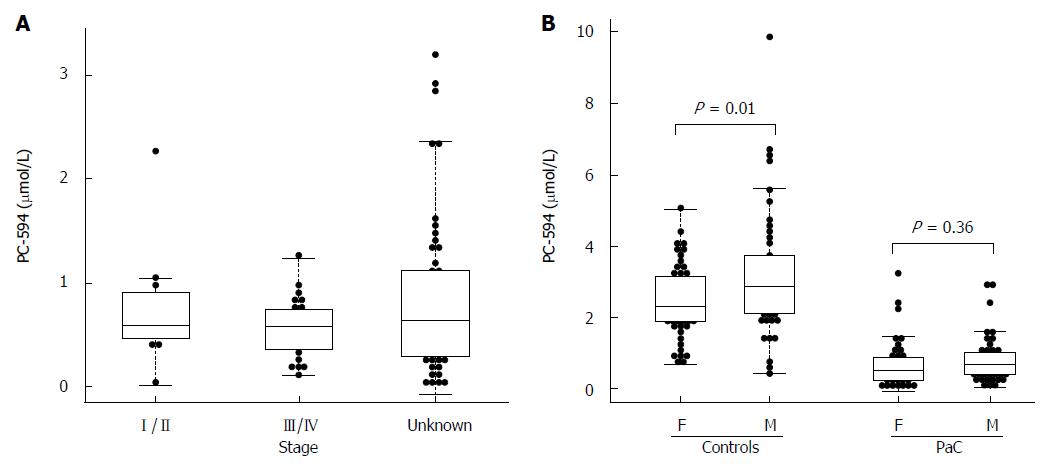
Figure 3 Beeswarm scatter plot of PC-594 levels by disease stage (A) and gender (B).
Boxes indicate the 25th to 75th percentile, while the horizontal line in the box represents the median level. Whiskers indicate the 5th to 95th percentile. PaC: Pancreatic cancer.
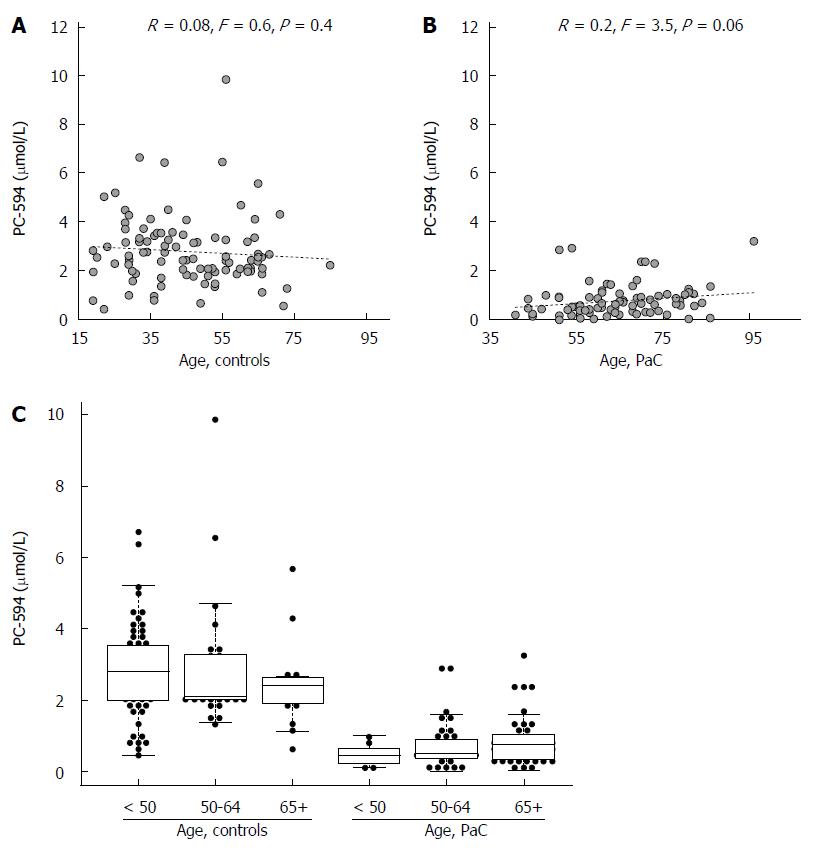
Figure 4 Age analysis.
Scatter plots of PC-594 level vs age for controls (A) and PaC patients (B); Beeswarm scatter plot of PC-594 levels by age in controls and PaC patients (C). Boxes indicate the 25th to 75th percentile, while the horizontal line in the box represents the median level. Whiskers indicate the 5th to 95th percentile.
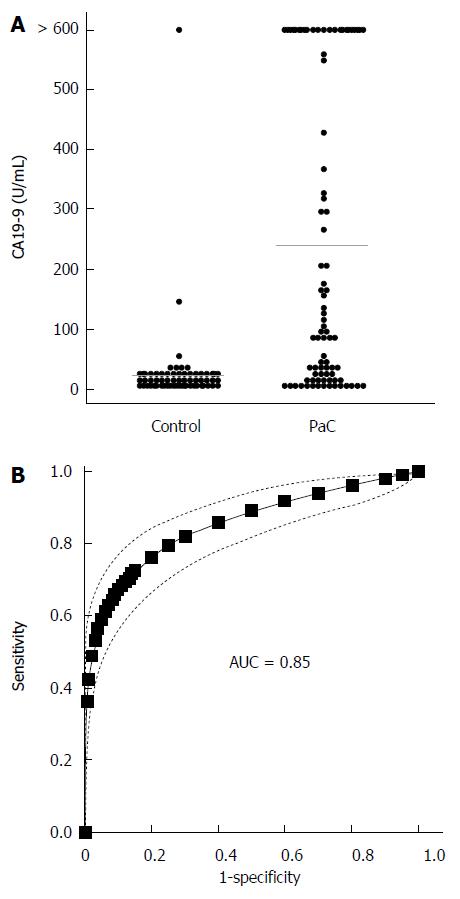
Figure 5 CA19-9 levels.
A: Beeswarm scatter plot of CA19-9 levels in controls and PaC patients. Grey lines indicate median levels; B: ROC curve based on CA19-9 levels; Dotted lines indicate the 95%CI.
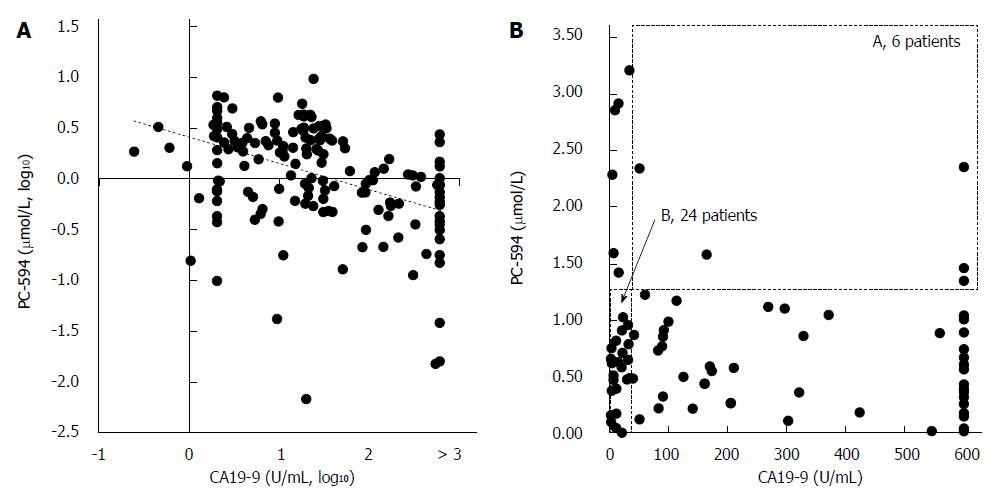
Figure 6 Correlation between CA19-9 and PC-594.
Scatter plots of PC-594 vs CA19-9 concentrations (A, log10; B, unlogged). In B, the dotted box A represents CA19-9 above 35 U/mL and PC-594 levels above 1.25 (elevated CA19-9 and normal PC-594), while the dotted box B represents CA19-9 levels below 35 U/mL and PC-594 levels below 1.25 (normal CA19-9 and abnormal PC-594).
- Citation: Ritchie SA, Chitou B, Zheng Q, Jayasinghe D, Jin W, Mochizuki A, Goodenowe DB. Pancreatic cancer serum biomarker PC-594: Diagnostic performance and comparison to CA19-9. World J Gastroenterol 2015; 21(21): 6604-6612
- URL: https://www.wjgnet.com/1007-9327/full/v21/i21/6604.htm
- DOI: https://dx.doi.org/10.3748/wjg.v21.i21.6604


