Copyright
©The Author(s) 2015.
World J Gastroenterol. Jun 7, 2015; 21(21): 6543-6549
Published online Jun 7, 2015. doi: 10.3748/wjg.v21.i21.6543
Published online Jun 7, 2015. doi: 10.3748/wjg.v21.i21.6543
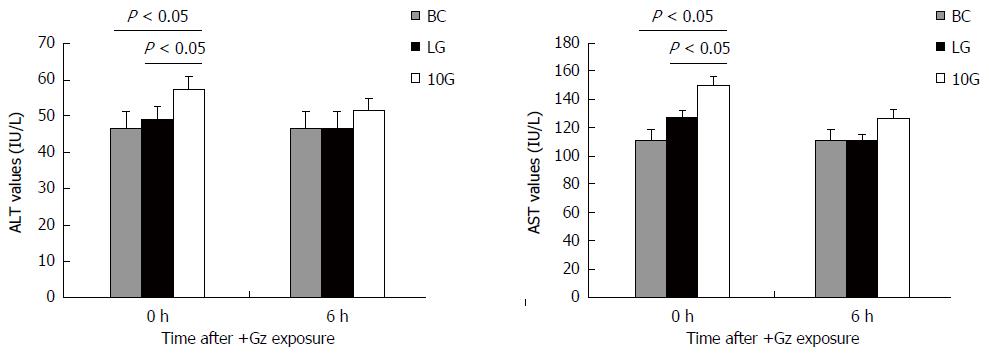
Figure 1 Comparison of rat serum alanine aminotransferase and aspartate aminotransferase levels at 0 and 6 h after +Gz exposures in the blank control group, low G preconditioning group and +10 Gz/5 min group.
Alanine aminotransferase (ALT) and aspartate aminotransferase (AST) in group low G preconditioning (LG) or group +10 Gz/5 min (10G) were higher than those in blank control group (P < 0.05 BC vs 10G) at 0 h after exposure, respectively. The rats in LG group showed lower ALT and AST levels than those in 10G group at 0 h after exposure (P < 0.05, LG vs 10G). BC: Blank control.
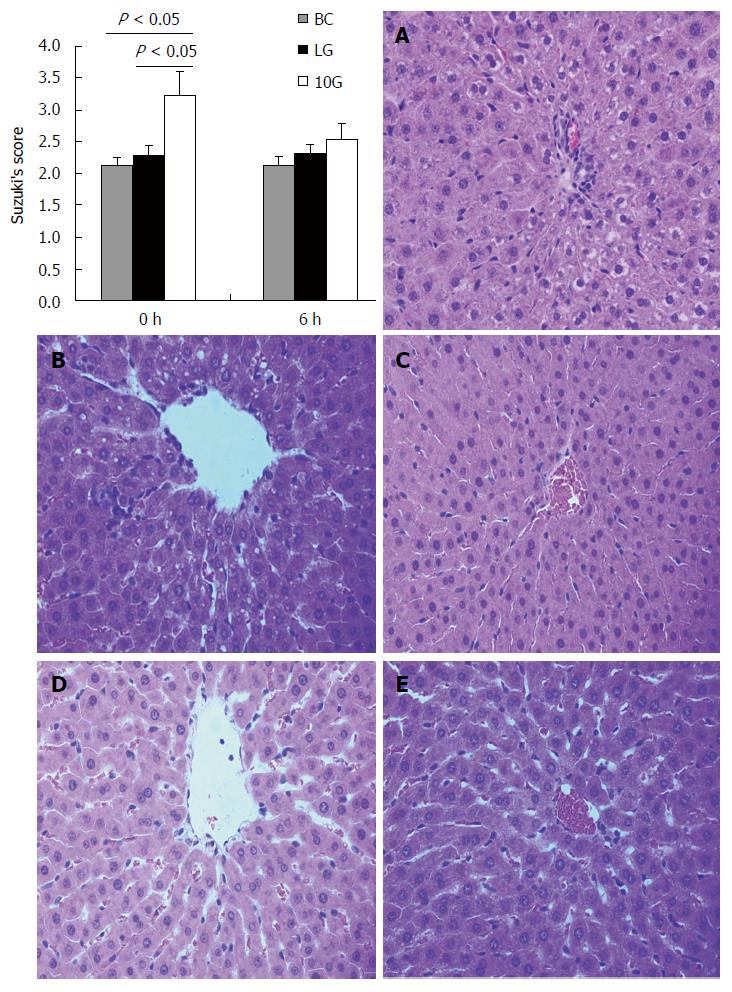
Figure 2 Pathological changes in the liver tissue at 0 and 6 h after +Gz exposures in the blank control group, low G preconditioning group and +10 Gz/5 min group.
No significant injury was found in blank control group (A: Suzuki’s score = 2.12 ± 0.13). At 0 h after exposure, there was disorderly hepatic sinus cord-like structure associated with hepatocyte edema in +10 Gz/5min (10G) group (B: Suzuki’s score = 3.23 ± 0.37). In sharp contrast, there was regular liver lobule structure in low G preconditioning (LG) group (C: Suzuki’s score = 2.28 ± 0.16). At 6 h after exposure, hepatocyte edema became lighter, and liver lobule structure had orderly arrangement in 10G group (E: Suzuki’s score = 2.53 ± 0.25; P < 0.01). There was no significant difference between 0 and 6 h after exposure in LG group (C and D: Suzuki’s score = 2.28 ± 0.16 vs 2.31 ± 0.14, P < 0.01). BC: Blank control.
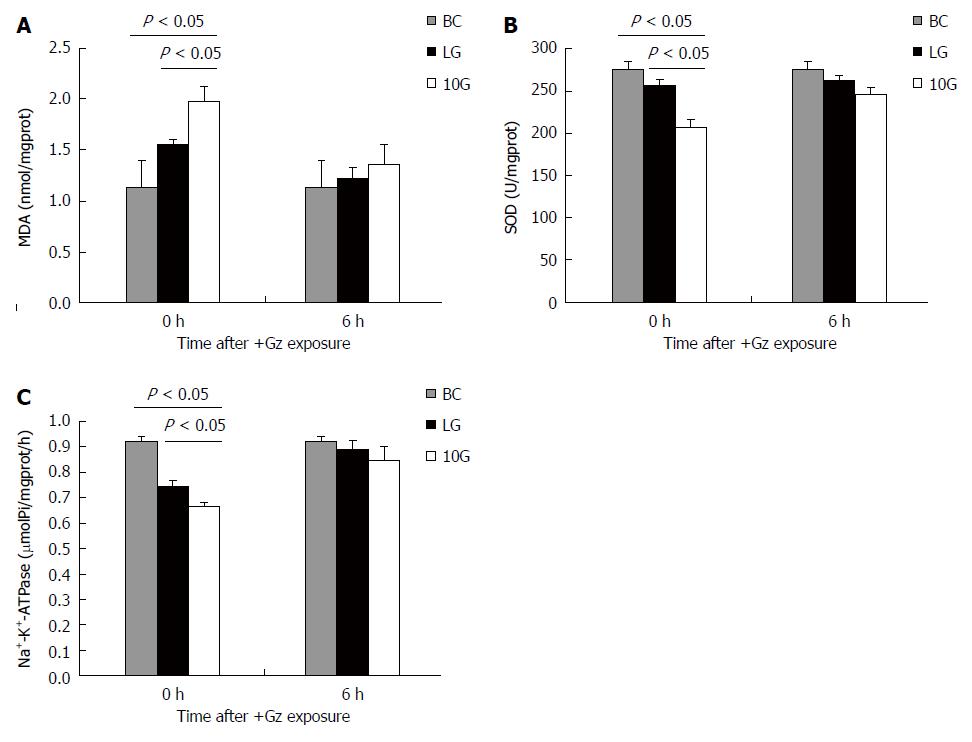
Figure 3 Comparison of the liver tissue malondialdehyde levels (A), the liver tissue superoxide dismutase levels (B) and the rat liver Na+-K+-ATPase activity (C) at 0 and 6 h after +Gz exposures in the blank control group, low G preconditioning group and +10 Gz/5min group.
A: Malondialdehyde (MDA) level in liver tissue of group low G preconditioning (LG) or group +10 Gz/5 min (10G) was higher than that of blank control group at 0 h after exposure (P < 0.05, BC vs 10G). MDA level in liver tissue in LG group was lower than that in 10G group at 0 h after exposure (P < 0.05, LG vs 10G); B: Compared with blank control group, liver tissue superoxide dismutase (SOD) level in LG or 10G group reduced significantly at 0 h after exposure (P < 0.05, vs BC). Compared to 10G group, SOD level was higher in LG group at 0 h after exposure (P < 0.05, LG vs 10G); C: The Na+-K+-ATPase activity in LG group was higher than that in 10G group at 0 h after exposure (P < 0.05, LG vs 10G). BC: Blank control.
- Citation: Shi B, Feng ZQ, Li WB, Zhang HY. Low G preconditioning reduces liver injury induced by high +Gz exposure in rats. World J Gastroenterol 2015; 21(21): 6543-6549
- URL: https://www.wjgnet.com/1007-9327/full/v21/i21/6543.htm
- DOI: https://dx.doi.org/10.3748/wjg.v21.i21.6543


