Copyright
©The Author(s) 2015.
World J Gastroenterol. May 28, 2015; 21(20): 6280-6286
Published online May 28, 2015. doi: 10.3748/wjg.v21.i20.6280
Published online May 28, 2015. doi: 10.3748/wjg.v21.i20.6280
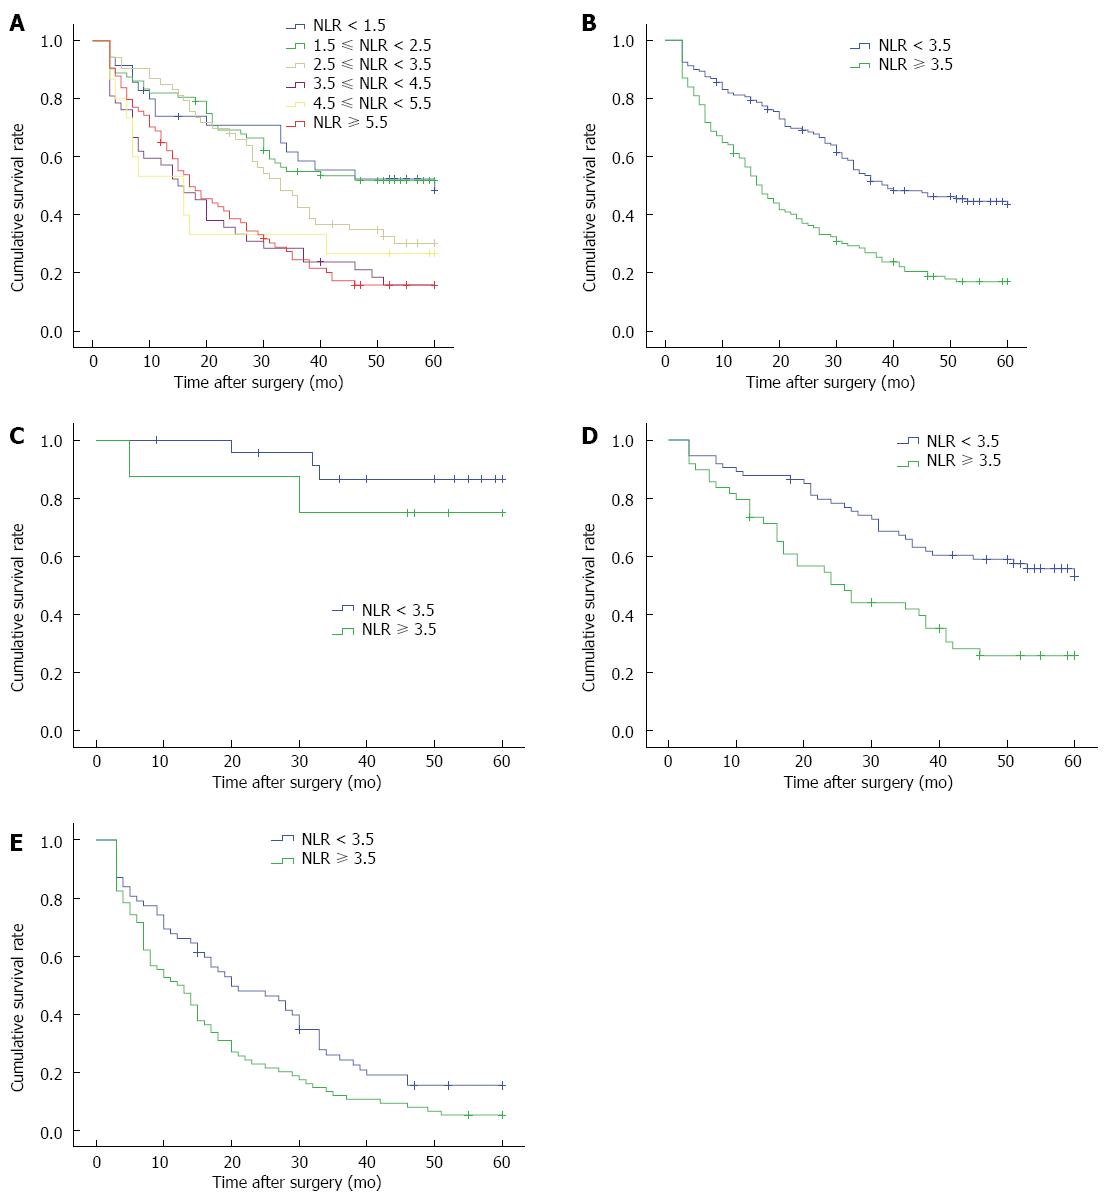
Figure 1 Five-year survival curves.
A: All patients; B: High- and low-neutrophil-to-lymphocyte ratio groups; C: Stage I patients; D: Stage II patients; E: Stage III patients. NLR: Neutrophil-to-lymphocyte ratio.
- Citation: Yu L, Lv CY, Yuan AH, Chen W, Wu AW. Significance of the preoperative neutrophil-to-lymphocyte ratio in the prognosis of patients with gastric cancer. World J Gastroenterol 2015; 21(20): 6280-6286
- URL: https://www.wjgnet.com/1007-9327/full/v21/i20/6280.htm
- DOI: https://dx.doi.org/10.3748/wjg.v21.i20.6280


