Copyright
©The Author(s) 2015.
World J Gastroenterol. May 28, 2015; 21(20): 6167-6179
Published online May 28, 2015. doi: 10.3748/wjg.v21.i20.6167
Published online May 28, 2015. doi: 10.3748/wjg.v21.i20.6167
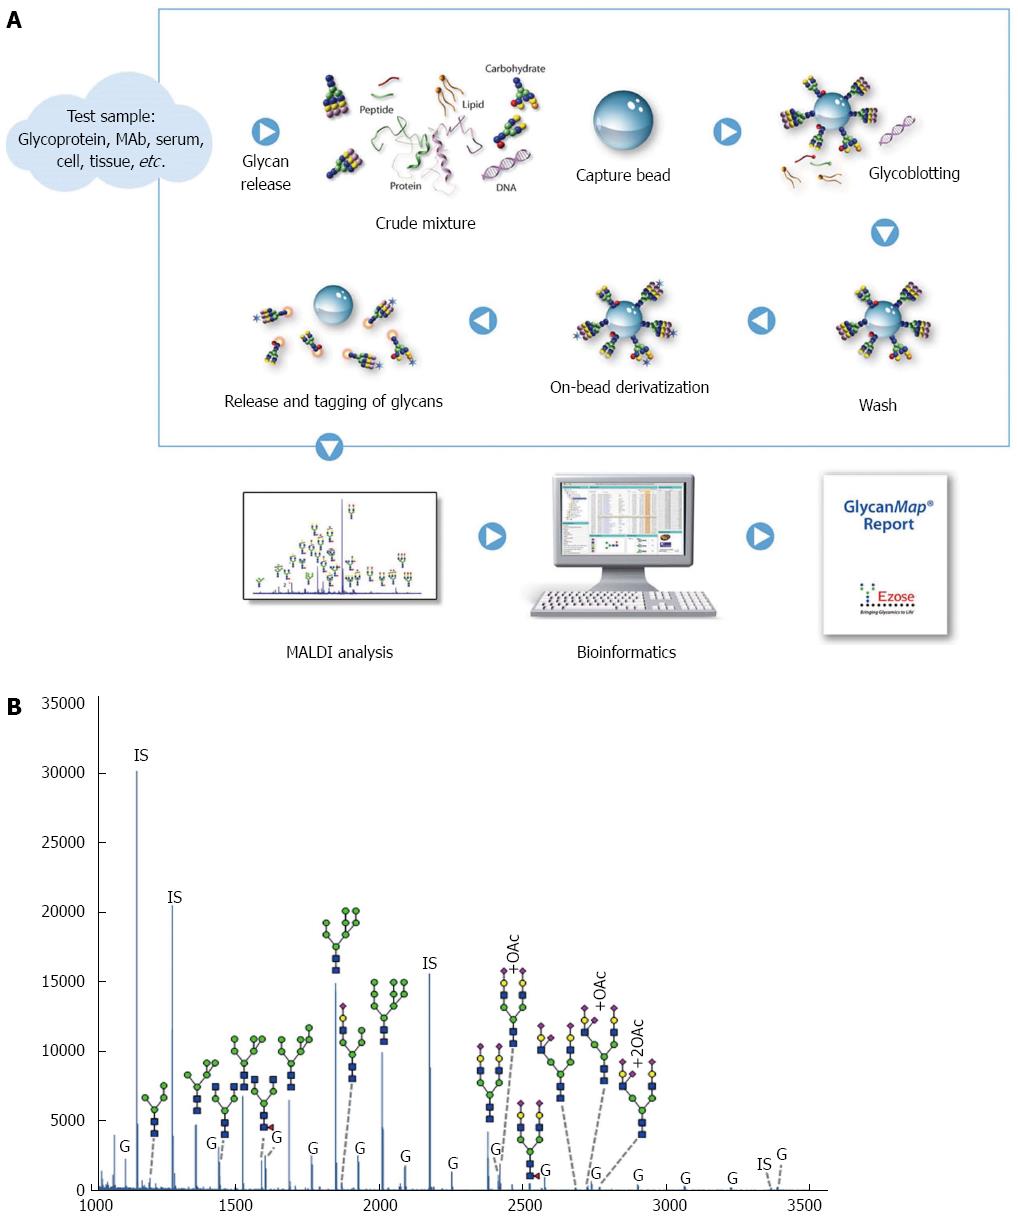
Figure 1 GlycanMap workflow.
A: Workflow; B: Glycan profile in rat liver lysates. The spectrum was generated from sample N5 and is representative of the N-glycan profile in rat liver lysates. Taking advantage of the symbol nomenclature of the Consortium for Functional Glycomics, selected peaks were labeled with the proposed glycan structures. All spectra were collected on a MALDI-TOF mass spectrometer in reflection mode, which yields high mass accuracy and isotopic resolution for more accurate glycan identification. Glycans were quantified by comparing the peak intensity of each glycan-derived peak to those of the internal standards (IS). The liver lysates also contained varying amounts of glycogen (G).
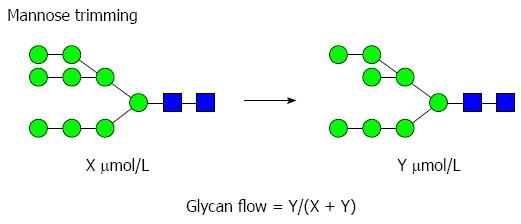
Figure 2 Example of a glycomics analysis of an individual biosynthetic step in the mannose trimming pathway.
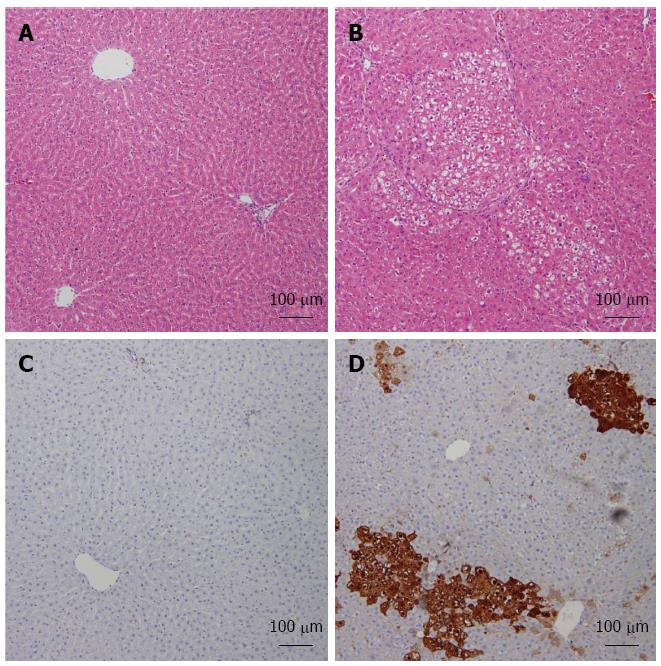
Figure 3 Diethyl nitrosamine-induced increase of foci in altered hepatocytes and induction of GST-p expression in liver.
Representative images of Hematoxylin and Eosin-stained liver sections from both studied groups: Normal (A), hepatocellular carcinoma (HCC) (B). Immunohistochemistry analysis of both normal (C) and HCC (D) livers labeled with GST-p are shown.
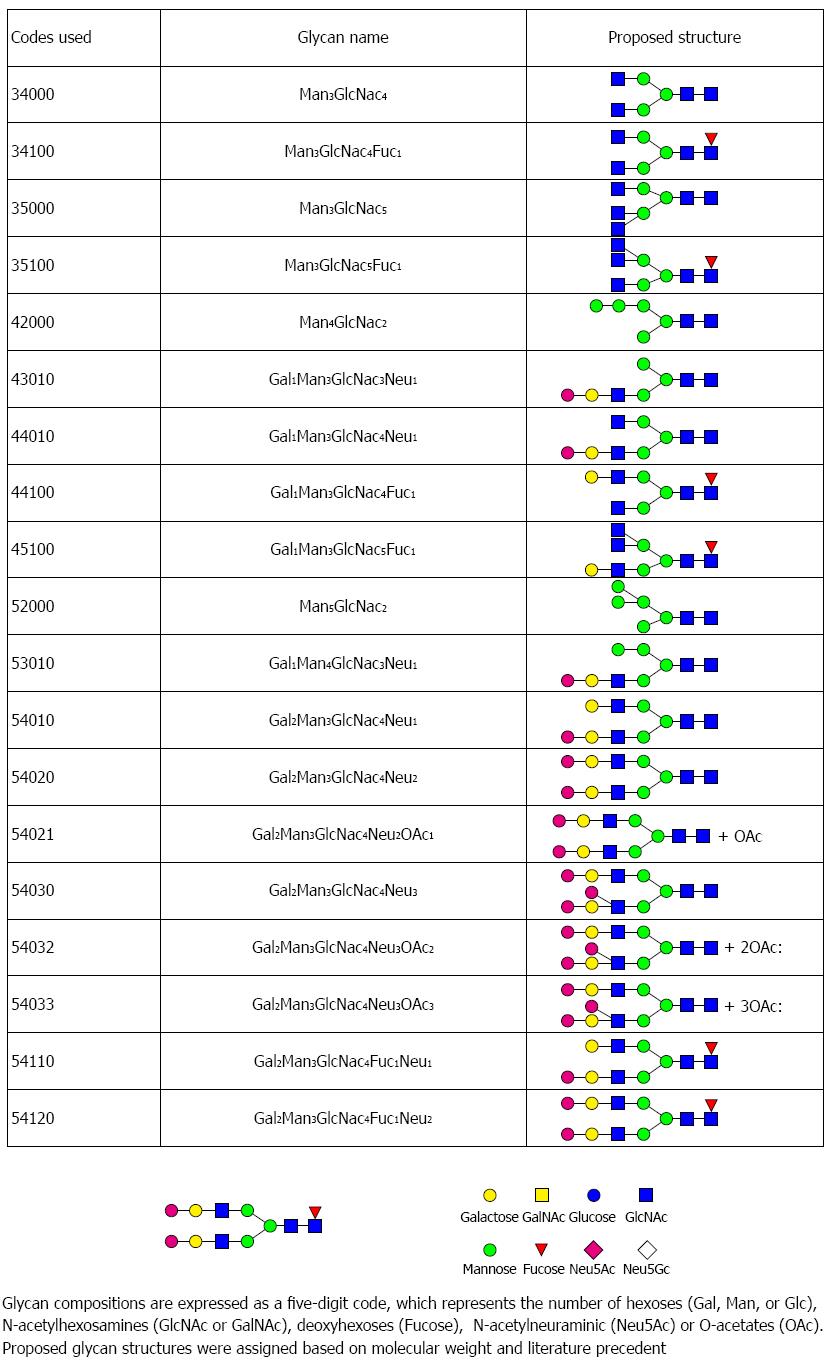
Figure 4 This figure lists the glycan codes and proposed structures for all 29 glycans detected in this study.
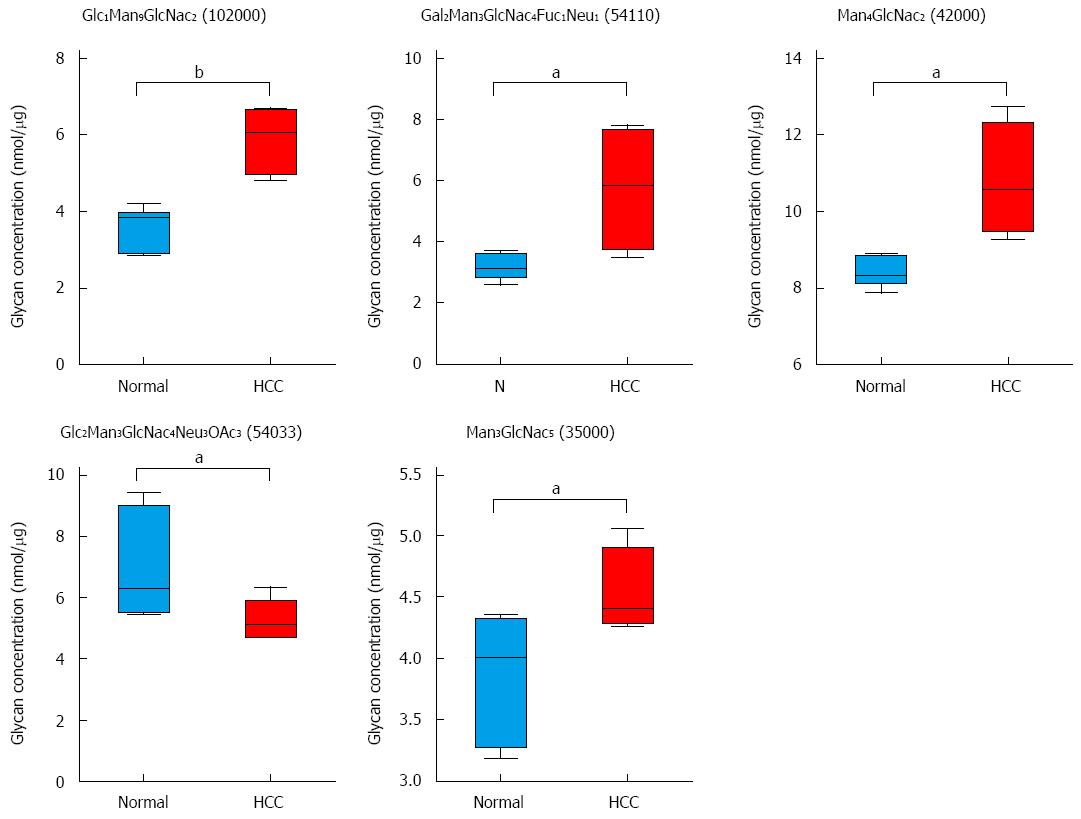
Figure 5 Hepatocellular carcinoma-related alterations in glycans in tumor-bearing animals.
Five glycans changed in tumor-bearing rats compared to normal rats. A combined scatter and box-and-whisker plot is shown for each glycan, along with an indication of the statistical significance (aP < 0.05, bP < 0.01 vs control, n = 7).
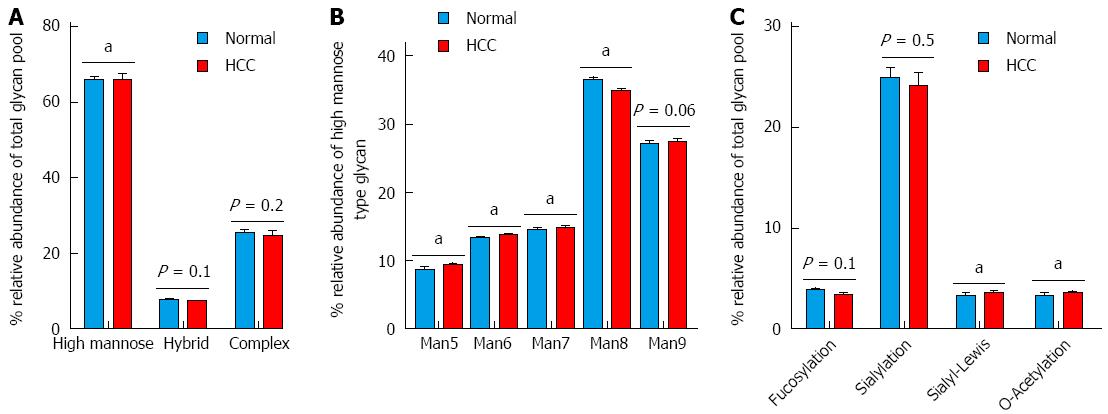
Figure 6 Differential expression of N-glycans structures and determinants.
A: N-Glycan structures i.e., high mannose, hybrid and complex; B: Distribution of the different types of high mannose structures (Man5 to Man9); C: Distribution of terminal glycan determinants: fucosylation, sialylation, sialyl-Lewis and O-acetylation. The groups were compared by t-test and aP < 0.05 vs control n = 7.
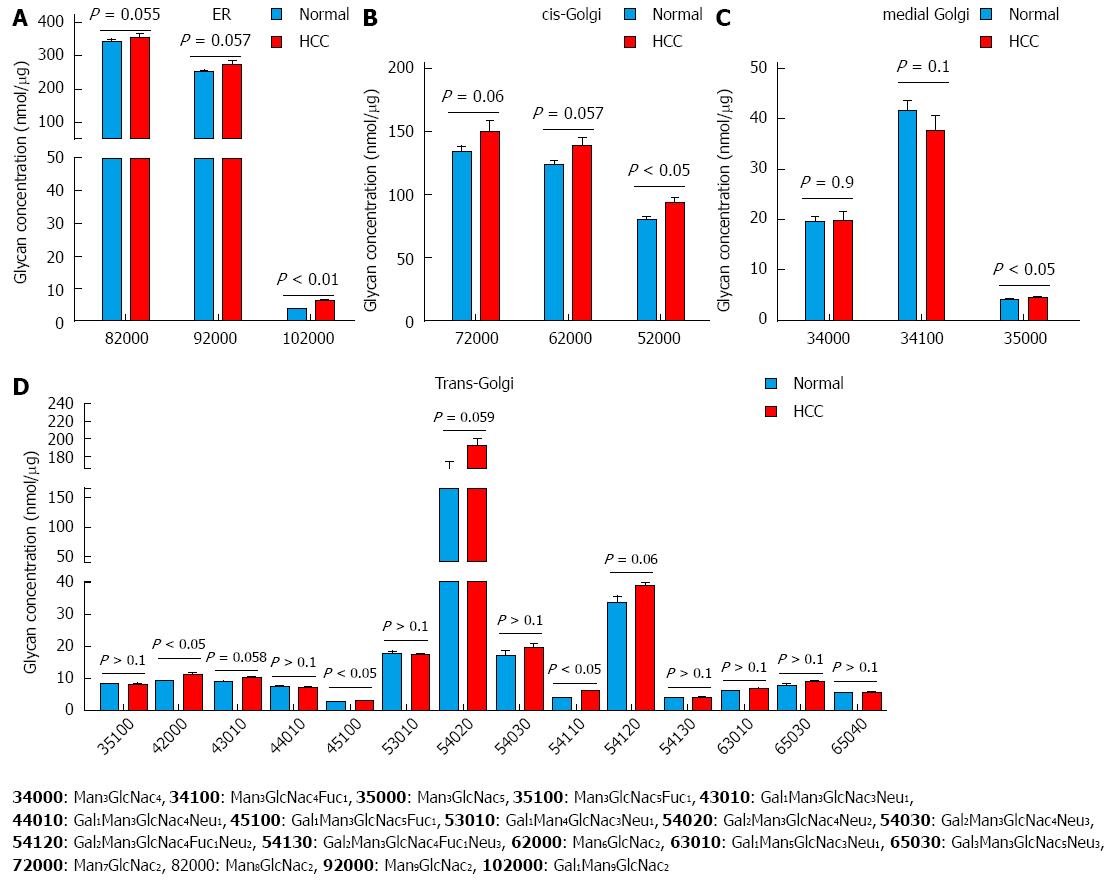
Figure 7 Analysis of glycan biosynthesis based on the compartments in which they are synthesized.
The glycans are synthesized in ER-Golgi by a chain of enzymes. Glycans synthesized. A: ER; B: Cis-Golgi; C: Medial-Golgi; D: Trans-Golgi. The groups were compared by t-test, P < 0.05, P < 0.01 vs control, n = 7.
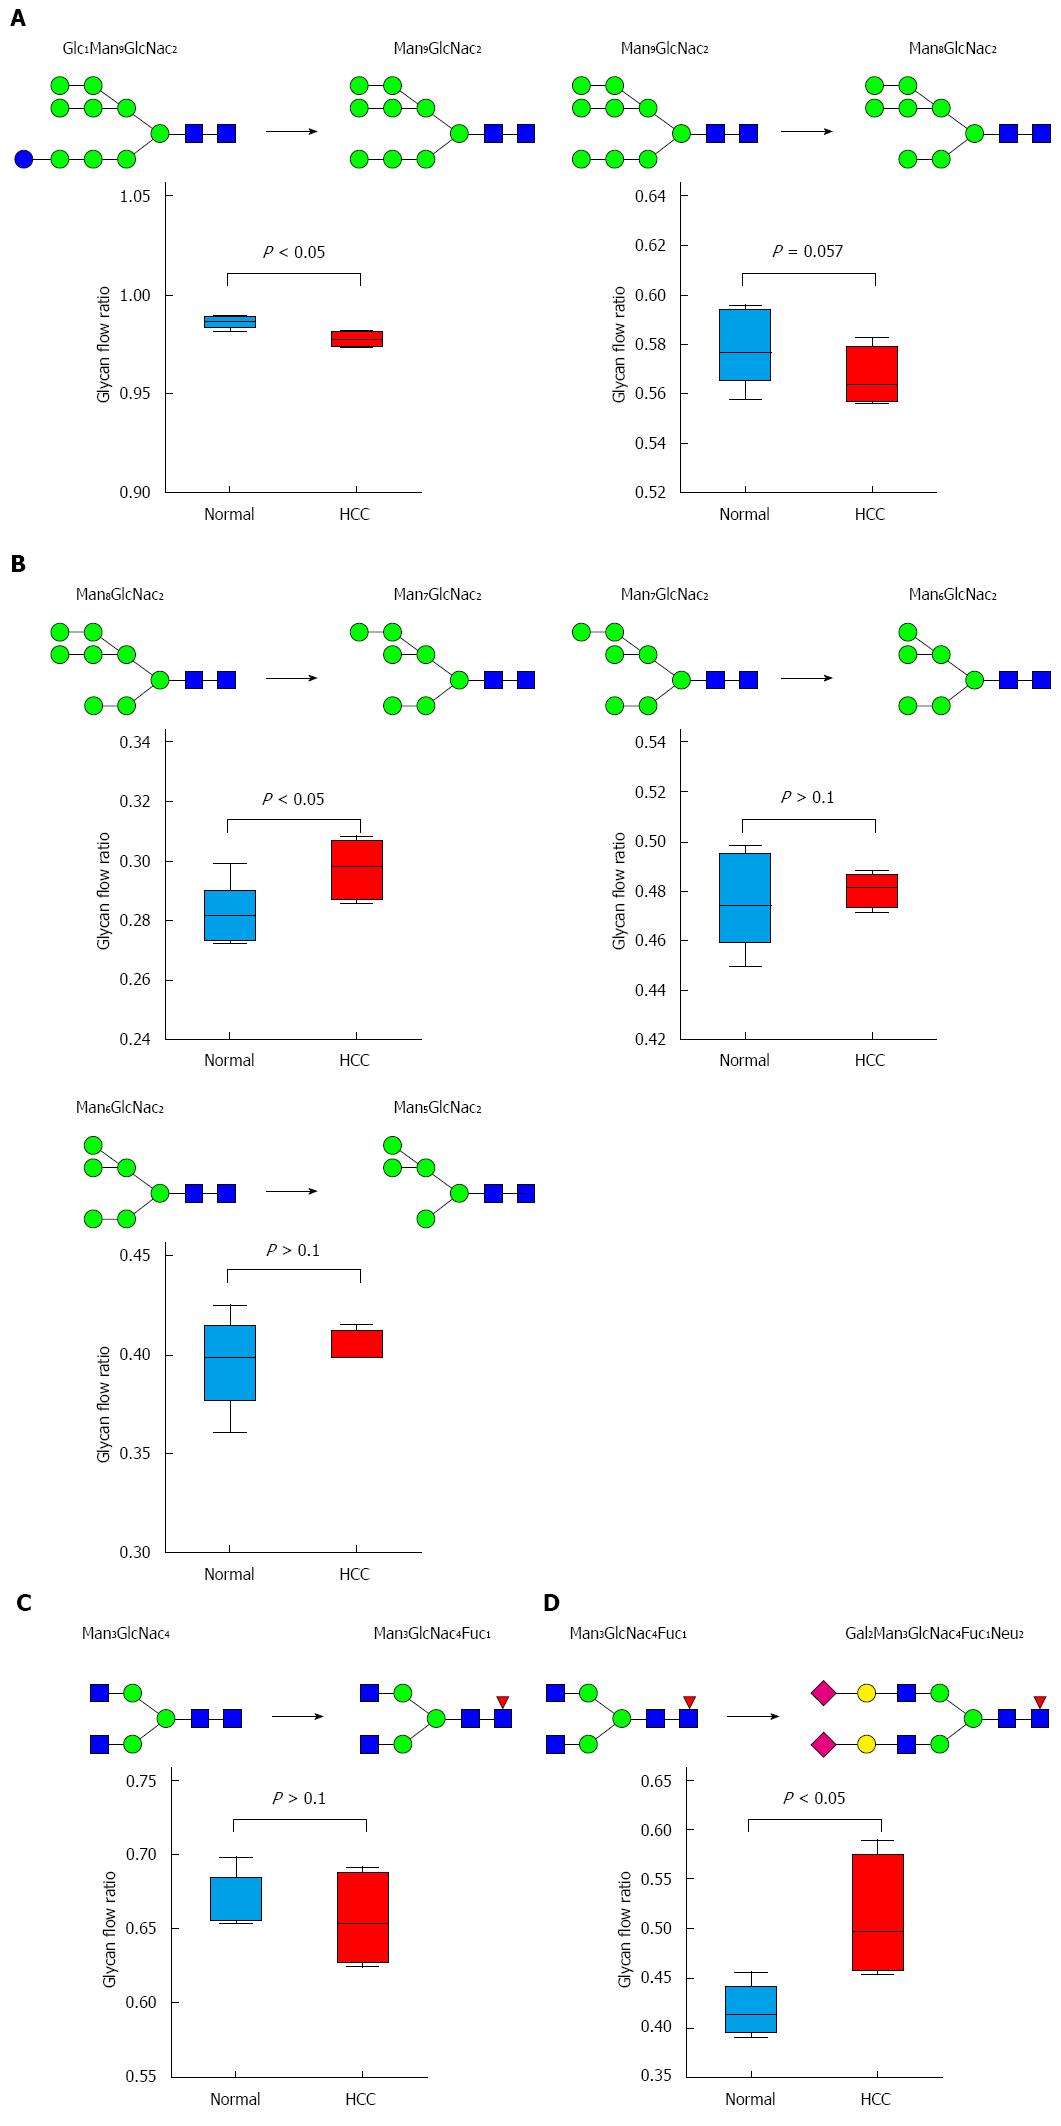
Figure 8 Glycan flow.
Changes in glycan flow in the N-glycan biosynthesis pathway. The ratio was compared by t-test and P value < 0.05 was considered significant. A: ER; B: Cis-Golgi; C: Medial-Golgi; D: Trans-Golgi.
- Citation: Amin A, Bashir A, Zaki N, McCarthy D, Ahmed S, Lotfy M. Insights into glycan biosynthesis in chemically-induced hepatocellular carcinoma in rats: A glycomic analysis. World J Gastroenterol 2015; 21(20): 6167-6179
- URL: https://www.wjgnet.com/1007-9327/full/v21/i20/6167.htm
- DOI: https://dx.doi.org/10.3748/wjg.v21.i20.6167


